cancel
Showing results for 
Show  only  | Search instead for 
Did you mean: 
Choose Language Hide Translation Bar

Graph Builder - Overlay by multiple columns

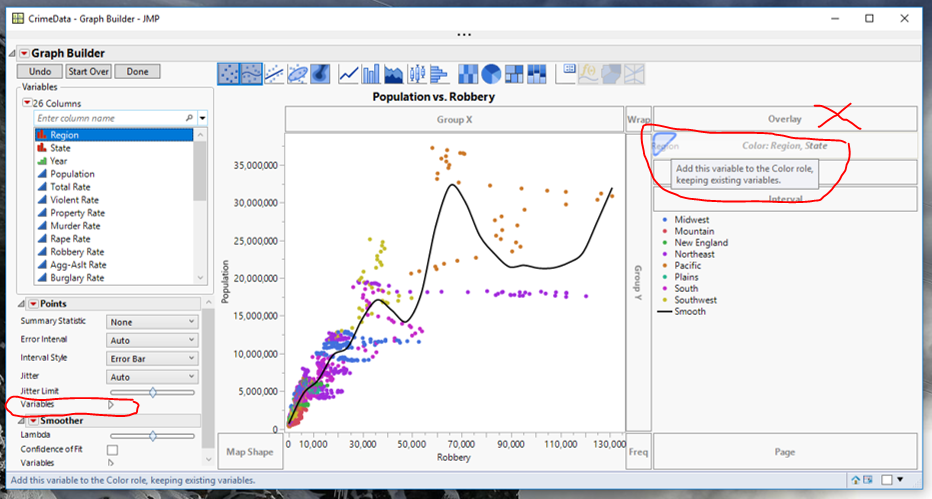
I would like to have Graph Builder be able to Overlay by several variables in the same way that x, y or color drop-zones can take several variables. This would allow overlay to be selected/deselected from the "Variables" group under each graph type and create much more complex and rich visualizations.

8 Comments
gzmorgan0
Super User (Alumni)

Currently,  there are methods that might meet your needs today:

  • Add a column switcher to your report that switches out the Overlay Variables,
  • Create a new Column, or transform a column to be a concatenation, and
  • for an additional level of control especially for nested overlay variables add a Local Data Filter

Row Switcher example

image.png


Transformed column example

image.png


Script for the transformed column example:

Graph Builder(
	Size( 491, 454 ),
	Show Control Panel( 0 ),
	Variables(
		X( :Robbery ),
		Y( :Population ),
		Overlay(
			Transform Column(
				"Region, State",
				Character,
				Nominal,
				Formula( :Region || ", " || :State )
			)
		)
	),
	Elements( Points( X, Y, Legend( 1 ) ), Smoother( X, Y, Legend( 2 ) ) ),
	Local Data Filter(
		Add Filter(
			columns( :Region ),
			Where( :Region == "Midwest" ),
			Display( :Region, Size( 160, 120 ), List Display )
		)
	)
)


morenopelaez_p
Level III

Thanks @gzmorgan0 , indeed, it can be achieved in several ways but I consider those "workarounds" ... I am more looking for the feature to have multiple fields in overlay, the same way that it was implemented for Color some time ago.

BHarris
Level VI

This is a great request and is something I often find myself wanting as well.  


Part of the reason is that the Overlay can be used with line plots to break the lines.  I often find myself wanting to break the lines when any of 2 or 3 variables change, but in order to do that I have to concatenate the columns together in the data table, which is a little clunky.

hogi
Level XI

Would be really nice to have this feature!


@XanGregg: Is there a reason why it is not possible to use several columns as overlay - and, for each subplot,  to pick the desired column via "variables" (like it is possible for all the other settings).


Surprisingly, it IS possible - triggered by this wish?

Hm, but looking closer, the result is not like expected?!

According to the JSL code and the legend, the two plots use different columns as overlay. 

Unfortunately, the "age" overlay looks like a "sex" overlay, just with different colors.


hogi_0-1677620744851.png


Graph Builder(
	Variables(
		X( :sex ),
		Y( :weight ),
		Y( :height ),
		Overlay( :sex ),
		Overlay( :age )
	),
	Elements( Position( 1, 1 ), Points( X, Y, Overlay( 2 )) ),
	Elements( Position( 1, 2 ), Points( X, Y, Overlay( 1 ) ) )
)
hogi
Level XI

related wish: Graph Builder: support more than 2 'Color' columns 

(>2 Colors instead of >1 Overlays)

hogi
Level XI

@Sarah-Sylvestre : an old wish with a lot of potential.

Attribute is stilll "new".

Are Jmp Developers investigating if this is possible?

Status changed to: Acknowledged

Hi @hogi, thank you for bringing this to my attention! Status should be acknowledged so I am updating it. This has been investigated but we have had several higher priority items that need to be worked on take precedence. I will check in on this item and update this wish if it becomes a higher priority relative to our other development work. 

 
hogi
Level XI

#myTop10_2023a