cancel
Showing results for 
Show  only  | Search instead for 
Did you mean: 
  • Don’t miss your chance to experience Discovery Summit Europe at our best available rate! Early bird registration through 31 Oct.
  • Graph Builder Toolbar streamlines interactive graphing. Creates shortcuts on Report and GraphBuilder Helpers toolbars. Download and install the extension.
  • JMP will suspend normal business operations for our Rest and Recharge Day on Friday, October 2, 2026.
    Regular business hours will resume on Monday, October 5, 2026.

JMP Wish List

We want to hear your ideas for improving JMP. Share them here.
Choose Language Hide Translation Bar
0 Kudos

Correct application of colour scale to points/lines

What inspired this wish list request? 


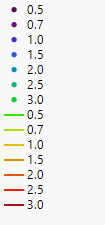
I made a plot using graph builder (x and y variables plus  an 'overlay' variable). I applied a colour scale to the points/overlay variable but it treats them independently! For example with the rainbow colour scheme i applied i get this result:
JMPinthePool_0-1689770015132.png


What is the improvement you would like to see? 


What I'd really like to see is that the line colours are representative of the colour of the dots/data points that they are fitted through. So my green lines should really be blue/purple, and my green dots should really be red/orange. 


Why is this idea important? 


Because as it is it just looks weird and makes it more difficult to interpret. 


1 Comment
hogi
Level XIII

just select the lines and apply the color setting via

hogi_0-1727626887157.png


to get the setting applied to the points as well, please remove the points from the legend.
[If the points are visible as well, JMP think that you want to apply different settings to the points]