Image to Table JMP extension imports single or batch images as data tables. Useful to extract curves from pictures or convert image data to curve data to use in analyses like Functional Data Explorer. Download and install the extension.
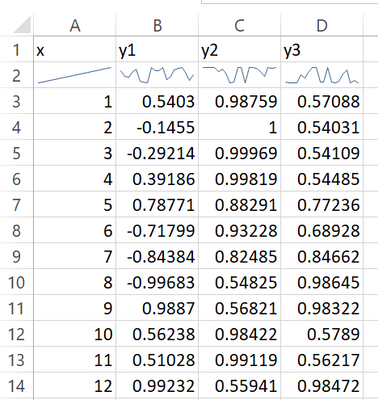
I do see the histogram / heat map / run chart options in the Preferences menu -> Tables -> Header Summary Graphs.
From what I can see, I'd have to choose globally whether I want say a histogram or run chart for all continuous properties. Can it be modified individually as appropriate?