cancel
Showing results for 
Show  only  | Search instead for 
Did you mean: 
  • DownloadSemiconductor Toolkit: Tools to create wafer maps, add wafer geometry to graphics, explore die defects & compare wafers.
  • Discovery Summit 2026: Early User Edition - September 23-24.Register. It's free.
  • Use JMP Clinical with CDISC-compliant data. Review studies, ID safety and efficacy signals & communicate findings with interactive graphics. Register to see how. Aug. 27, 2 pm US ET.

JMP Wish List

We want to hear your ideas for improving JMP. Share them here.
Choose Language Hide Translation Bar

Animated GIFs should be right-click accessible

Hi,


I use the nominal logistic fit model frequently and I wish it would allow me to right click on a prediction profiler graph and select 'save as animated GIF' which would simply make an animated GIF of the profiler response from the minimum to maximum value.  Perhaps allowing the user to select some level of increment speed.  I would be open to a script in the short-term but this seems like a logical extension of this platform.


regards,

bac
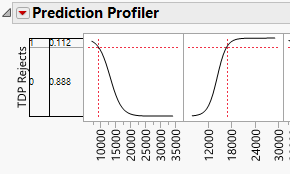
 

fit model.PNG


2 Comments
Jeff_Perkinson
Community Manager
Status changed to: Needs Info

This is challenging because the GIF would only be able to animate one factor. In a profiler with many factors it would be difficult to tell which factor is the right one to use. Saving the profiler as interactive HTML is probably a better solution.

ih
Super User (Alumni)
Super User (Alumni)

For this situation I prefer to output the profiler predictions in a factor grid and then plot them along with the original values.  This gives more flexibility and more information than was in the profiler.


An example of what this might look like, here the center of each dot shows the actual petal width:

ih_2-1605808494847.png