This type of analysis is in the family of analysis of covariance (ANCOVA) models, and examples are available in the JMP® Fitting Linear Models book. Go to Help ► Books ► Fitting Linear Models. For more information about ANCOVA models, see (1).
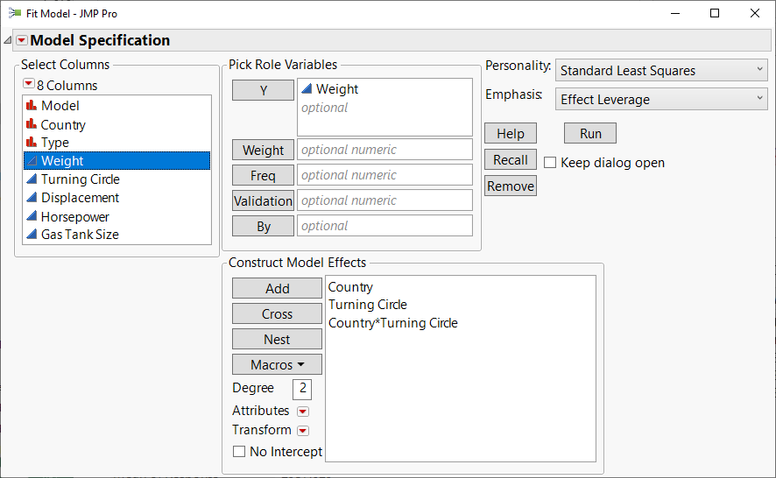
Consider an example using the Car Physical Data sample dataset available in the JMP Sample Data Library. Regress Weight on Turning Circle, Country, and Country*Turning Circle.
Analyze ► Fit Model:

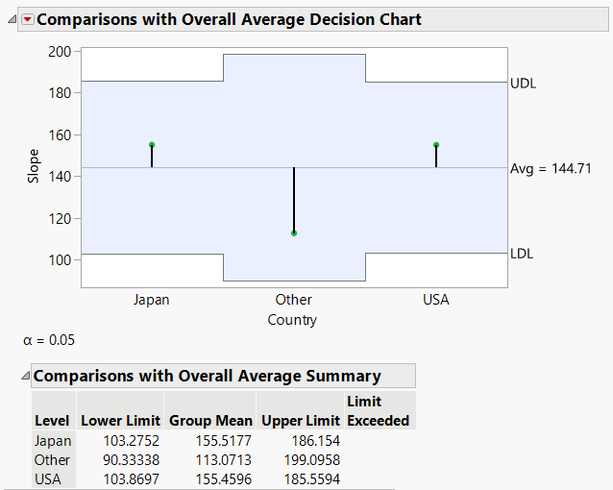
From the top red triangle menu, select Estimates ► Compare Slopes. Under the red triangle menu for the Comparisons with Overall Average Decision Chart header, select ► Show Summary Report.

JMP produces a report that plots the magnitude of the slope for each level of the factor Country, relative to the overall average slope (averaging across all levels of that categorical factor), and with lower/ upper decision limits (LDL, UDL). The plot and results are an analysis of means (ANOM) test. If one or more slopes' value exceeds the decision limits, then this indicates that that slope(s) is statistically significantly different from the overall average slope.
For more information, see the section in JMP's support documentation under Basic Analysis > Oneway Analysis > Statistical Details for the Oneway Platform > Statistical Details for ANOM.
To make specific pairwise comparisons of the slopes (among any two levels Country), a different approach is needed.
To reveal a test of slopes, go to the top red triangle the Fit Model report, and select ► Estimates ► Indicator Parameterization Estimates.

This produces a table of parameter estimates based on indicator parameterization: the last level of Country is used as the reference category and estimates are differences from that reference category.

Note that estimates for USA are not provided because USA is the reference category. Turning Circle, with the estimate of 155.46, is the slope for the reference category, in this case USA.
Country[Japan]*(Turning Circle-38.5862), with the estimate of 0.058 indicates how much the slope for Japan differs from the slope for USA on average.
Country[Other]*(Turning Circle-38.5862), with an estimate of -42.39 indicates how much the slope for Other differs from the slope for USA on average.
To get the final slope that compares Country[Japan] to Country[Other], the analysis has to be respecified to treat Japan or Other as the reference category, and then re-run. To change the reference category, change the Value Ordering property for the column Country. Right click on the column in the table and go to Column Info. Click on Column Properties, and then select Value Ordering. To change the ordering, select "Other" and click Move Down. The last category listed will be the reference category. Click OK.

To rerun the model, select the top-red triangle in the Fit Model report and select Redo ► Redo Analysis. Now the Indicator Function Parametrization report outline reports the model Estimates with Other as the reference category.

So, Country[Japan]*(Turning Circle-38.5862), with an estimate of +42.45 indicates how much the slope for Japan differs from the slope for Other on average.
So, all three tests for all possible Pairwise comparisons of slopes are now provided.
Japan vs USA, difference = 0.06, p = 0.9985.
Other vs USA, difference = -42.38, p = 0.2193.
Japan vs Other, difference = 42.45, p = 0.2204.
(1) References: Analysis of Covariance: A Delicate Instrument, Elashoff, Janet D., American Educational Research Journal, Vol. 6, No. 3 (May, 1969), pp. 383-401, Americal Educational Research Association http://www.jstor.org/stable/1161858
[Previously JMP Note 35410]