[分析]メニューにある[一変量の分布]や[二変量の関係]では生データを用いて分析を行う必要があるため、標本平均値や標本標準偏差、標本サイズといった要約統計量から検定を行うことはできません。
これらの情報をもとに検定を行う場合には、JMPをインストールした際に保存されるサンプルスクリプトを使用できます。
例として、次の情報を用いて1標本の両側t検定を実施してみます。
仮説平均:10
標本平均:10.5
標本標準偏差:1.3
標本サイズ:30
α水準:0.05
例 1標本のt検定(両側)
1. [ヘルプ]メニューから[サンプルの索引]を選択します。
2. 「①コンテンツの種類」で[ツール]、「②ツールの種類」で[計算]を選びます。
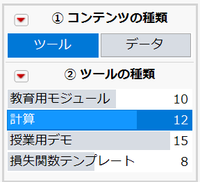
3. 右側に表示される一覧から[TestMean.jsl]を選んで[開く]をクリックします※。
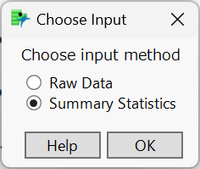
4. 「Choose Input」ウィンドウで[Summary Statistics]を選び、[OK]をクリックします。
5. 新しいウィンドウが表示されるので、次のように設定します。
Choose Type of Test:t-test
Choose type of alternative Hypothesis:Population mean is not equal to hypothesized mean (two-tailed)
Hypothesized Mean:10
Sample Average:10.5
Sample Standard Deviation:1.3
Sample Size:30
Significance Level (alpha):0.05
6. Test Resultsに結果が表示されます。この例ではp値は0.0439で有意です。

※この例では1標本のt検定を行いましたが、上記手順3で選ぶファイルを変更することで要約統計量を用いて異なる検定を行えます。
TestProportion.jsl ⇒ 1標本割合の仮説検定
TestTwoSampleMeans.jsl ⇒ 2標本平均の仮説検定
TestTwoSampleProportions.jsl ⇒ 2標本割合の仮説検定
TestTwoSampleVariances.jsl ⇒ 2標本分散の仮説検定
etc.
なお、JMP Student Editionでは[学生]メニューから同様の分析を行えます。