 Who were you hoping was the winner? Anna? Elsa? Dumbo? Olaf? (Photo by Caroll Co)Last time, I talked about the diecast car race experiment that I ran with my 5-year-old daughter on a recent vacation day. She and I set up a 6-lane racetrack for diecast cars that I had. She picked out 10 cars from among her favorite cars, and we set out to find out who the fastest racer is. My daughter was interested in seeing if the "best" racer would be either of a pair of princesses (one of whom has magical ice powers).
As a reminder from last time, we're going to analyze this as a choice experiment. Our "preferred choice" will be the winner in each race.
The results are in!
Data Collection
For the purposes of running the races and collecting the data, it did take a bit of additional work with the data table. When I clicked the “Make Table” button, I needed to ensure “Include order column” was checked, since this represents the lane number, which I changed the column name.
We decided to run each “block”, i.e., set of 6 cars in the specified order, 10 times consecutively. We still needed this to get reasonable estimates from the Choice Model. Even though we’re running 6 cars at a time, we’re only getting one piece of information (the winner) from each set.
I created a RaceID column to represent each unique race with 150 values (15 blocks * 10 races/block) repeated 6 times, and filled in the response column of all 0’s. Then for each race (RaceID), we would simply change the value for the winner to a value of “1”. All of this was easy using the data table column filling capabilities.
The Results
Once we had the results, we had to setup the choice model. The “Model” script attached to the data table is not appropriate as we want to analyze this as a choice experiment rather than a linear regression model. The choice model platform can be found under Analyze->Consumer Research->Choice.
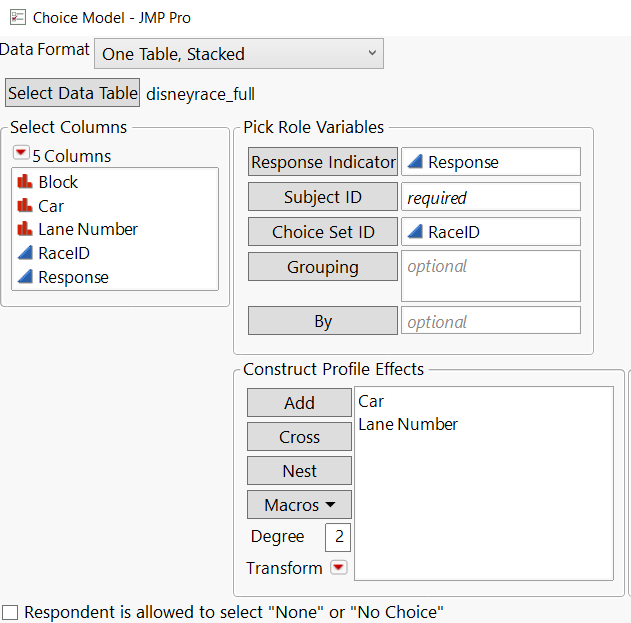
Setting it up is straightforward – the Response Indicator is our Response, and the RaceID is the Choice Set ID. Our profile Effects are Car & Lane Number. The launch dialog looked like this:

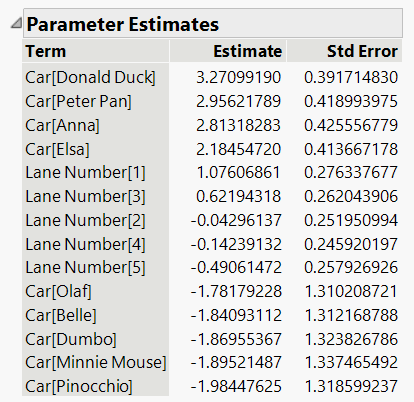
Looking at the results, I was not surprised that the Car effect was significant, as there were only 4 cars that even won a race. The Lane Number effect was a bit surprising – at least it wasn’t obvious while doing the experiment.

Sorting the parameter estimates (which reflect the utility – think bigger is better), we can see that there was something with the lane effect – most notably Lanes 1 & 3 being better, but also 1-3 vs. 4-6. It wasn’t obvious while doing the experiment, but we can use this model to see how it predicts certain races.

Confirmation Runs
One of the most interesting pieces from the results was Anna having a higher utility than her sister Elsa. My daughter had paid close attention to their matchups, and during the experiment, it would have seemed that Elsa was more likely to win.
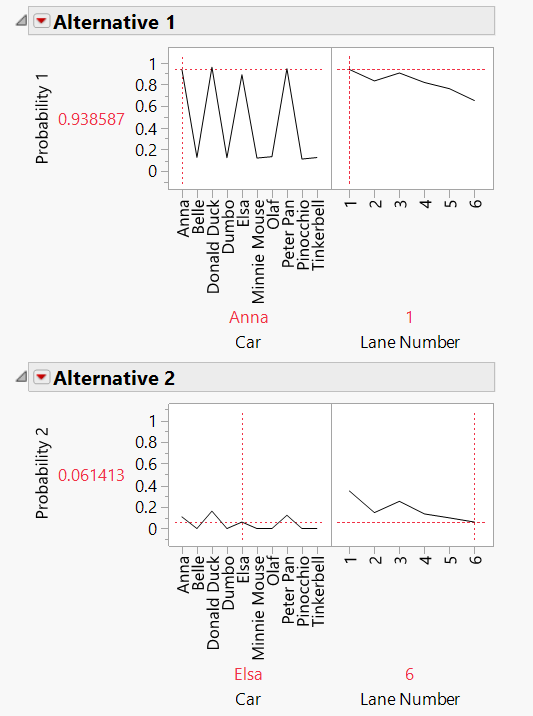
From the red triangle, we can select “Multiple Choice Profiler,” which allows for exploring the estimated probabilities for a set of alternative inputs. For our purposes, we tried 2 alternatives, since this is easy to test. I tried to make it as lopsided as I could as I could, which was Anna in Lane 1, and Elsa in Lane 6. Our model was predicting a probability of 0.94 for Anna versus 0.06 for Elsa.

After 6 consecutive wins for Anna, my daughter decided that my computer must be magic.
Final Thoughts
The “Lane” effect was real and much more significant than I would have thought. Because of it, this ended up being a good teaching experience and a much more interesting experiment. While the princesses were not right at the top (Donald took the top spot, and Peter Pan was slightly ahead of Anna), my daughter and I had a blast performing this experiment.
Once we looked at the results, my daughter quickly picked up on being able to influence the chance of winning based on the visualizations. Even without being able to understand the model, there’s a lot to be said for the visualizations within JMP and the idea of “higher is better.” She also started to find cars from her collection that could beat a given car in Lane 1.
Her diecast collection has been growing, so hopefully we’ll have another racing experiment in the future. My own collection has a number of iconic cars from movies and televisions shows, so I might have to bring some of those in. Let me know if you have any requests in the comments, and thanks for reading!
You must be a registered user to add a comment. If you've already registered, sign in. Otherwise, register and sign in.