- New to JMP? Join us Sept. 23-24 for the Early User Edition of Discovery Summit, tailor-made for new users. Register now for free!
- Your voice matters! Tell us how you prefer to receive JMP updates, so we can tailor our communication to your needs. Take short survey.
- See how to access JMP Marketplace - and - find, create & share add-ins to extend your JMP. Watch video.
JMP Blog
A blog for anyone curious about data visualization, design of experiments, statistics, predictive modeling, and more- JMP User Community
- :
- Blogs
- :
- JMP Blog
- :
- Teaching Statistical Thinking with JMP Student Edition: A classroom-ready analyt...
- Subscribe to RSS Feed
- Mark as New
- Mark as Read
- Bookmark
- Subscribe
- Printer Friendly Page
- Report Inappropriate Content


When I started my doctoral work in speech technology at Ruhr-Universität Bochum in the early 1990s, AI was not a term anyone used casually. We had hidden Markov models, neural networks with a handful of layers, and an enormous amount of manual feature engineering. Everything had to be understood. There was no shortcut to the statistics: the data, models, or decisions. You had to know what you were doing and why.
Fast-forward three decades. I now work with university instructors across Europe who are trying to teach that same discipline – statistical reasoning and analytical judgment – to students who carry more computing power in their pockets than our entire institute had in 1994. And many of those students arrive expecting a tool to do the thinking for them.
That tension is what this series is about. Not whether AI belongs in the statistics classroom – it does, in some form – but how we make sure it sharpens rather than replaces the reasoning we are trying to teach.
Before we get to AI, though, I want to make the case for something more fundamental: what a genuinely good teaching tool looks like before AI enters the picture at all.
The problem with most teaching tools
Statistics is hard to teach. Not primarily because the mathematics is inaccessible since most introductory content is not beyond a motivated undergraduate. The real difficulty is connecting method to purpose. Students learn a t-test. They learn a chi-square test. They learn a regression. What they often do not learn is when to use which, and why that choice matters.
Tools that require coding such as R or Python shift cognitive load to syntax. Students spend the session debugging a loop rather than thinking about their data. That is not a criticism of those tools; they are genuinely powerful and important. But for introductory statistics, those kinds of tools often get in the way.
At the other extreme, fully automated tools answer the question before the student has had a chance to ask it.
What most instructors look for but rarely find is something in between: a tool that is powerful enough for real analysis but structured enough to support learning. It needs to be something that’s used in a professional environment, not a simplified teaching tool.
What JMP Student Edition actually offers
JMP Student Edition [2] is the version of JMP designed specifically for academic use. It is not a cut-down product. It covers the analytical range that introductory and intermediate statistics courses actually need, and it is the same environment that many students will encounter if they move into industry or research roles after graduation.
What makes it well-suited for teaching is a combination of things that are easy to underestimate:
- Visual before numerical. JMP puts graphs at the center of analysis. Students see the data before they see the statistics. It is not a design preference; it is a pedagogical choice that aligns with how statistical intuition actually develops.
- Interactive as default. Plots are live. You can select a point, a region, a bar, and the rest of the output responds. Students explore rather than compute.
- Interpretation required. JMP does not tell students what their results mean. It produces output, whether as distributions, residual plots, or test statistics, and then expects the analyst to read it. Learning happens in the gap between output and interpretation.
- Breadth without unnecessary complexity. The platform covers the GAISE College Report framework [5], the widely used guidelines for teaching introductory statistics, without overwhelming beginners. The full menu is there so the course can be scoped appropriately.
That last point matters more than it might seem. Prof. Koo Rijpkema and I explored this feature directly in a recent JMP Discovery Summit Europe presentation and webinar [4]: JMP is a professional-grade tool, and that breadth can feel overwhelming to new users. Structuring the learning environment by deciding which menus, which workflows, and which level of output to use is itself an important part of course design. JMP Student Edition gives instructors enough room to make those choices deliberately.
A natural learning flow
Many professors choose JMP Student Edition because they prefer the flow of JMP’s statistical analysis: start with data, explore visually, then move toward inference. That sequence is not arbitrary. It reflects how experienced analysts actually work, and it builds habits that transfer beyond the course.
The GAISE College Report [5], the most widely cited framework for introductory statistics education, recommends exactly this approach:
- Teach statistical thinking, not just statistical procedures.
- Use real data.
- Emphasise conceptual understanding over mechanical computation.
- Foster active learning.
JMP Student Edition, used thoughtfully, supports all four goals.
A practical bridge: Rule-based guidance with DAD
One of my favorite classroom tools is a JMP extension called the Data Analysis Director (DAD) [3]. Since it isn’t generative AI, it does not chat, generate text, or produce explanations by language model. What it does is follow a structured analytical logic to guide users toward an appropriate analysis method.
When a student is facing a specific analysis task, DAD asks a small number of focused questions: What is your response variable? Is the data continuous, nominal, or ordinal? What are your predictors? Based on those answers, it suggests an appropriate analysis and explains the reasoning behind the suggestion.
It may seem simple, but it is incredibly powerful as a teaching tool.
In class, I often give students a data set, such as customer satisfaction data with mixed variable types, and ask them to use DAD to choose an analysis. Then I ask something unexpected: Do you agree with it?
- What assumptions is the tool making?
- Would you choose differently?
- What might it be missing?
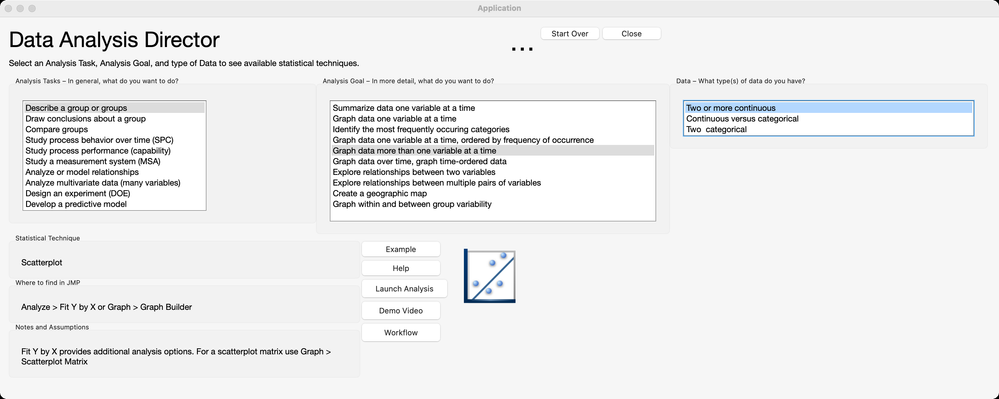
The real learning happens when those questions are answered. DAD externalizes the decision logic that an experienced analyst applies automatically but that beginners often don’t even know exists. It makes the reasoning visible, so students can examine it, question it, and learn from it.
And that is the key distinction: DAD is not an oracle. It is a rule-based analysis navigator, one that is transparent, inspectable, and deterministic. Students are not handed an answer. They are shown a reasoned starting point and asked to engage with it.
“AI should sharpen, not replace, our reasoning.” |
Before AI enters the picture
This episode has deliberately stayed away from generative AI – the large language models, the chatbots, and the tools that can write code, draft interpretations, and answer almost any question a student might ask. That is coming, starting in Episode 2.
I’ve deliberately started the series with this post that explains how JMP Student Edition already supports strong statistical thinking without a single AI feature switched on. I’m not arguing against AI, merely laying the groundwork before evaluating it. If you do not know what good analytical reasoning looks like before AI is involved, it is very hard to judge what AI actually adds, as well as what it quietly takes away.
The next episode looks at exactly that: what happens when large language models enter the statistics classroom, what they genuinely offer instructors, and where the first complications start to appear.
Try this
Install the Data Analysis Director [3] from the JMP Marketplace and open it from the Add-ins menu. Then answer all questions based on your data at hand. Let it suggest an analysis and then ask your students whether they agree, and why. The discussion that follows is often more instructive than the analysis itself.
References
[1] JMP Academic Program, jmp.com/academic
[2] JMP Student Edition, jmp.com/student
[3] Data Analysis Director (JMP Marketplace), marketplace.jmp.com
[4] Lost in JMP? Slimming Down for a Better Fit, Kraft & Rijpkema, JMP Discovery Summit EMEA 2026
[5] GAISE College Report (2016)
[6] GAISE College Report revision (in progress, 2025)
About the Author
Volker Kraft is Principal Academic Ambassador (EMEA) at JMP Statistical Discovery (a SAS company), part of the JMP Global Academic Team. Since 2011, he has supported universities across Europe as they integrate JMP into teaching and research. His background is in speech technology research, a field where statistical rigor and engineering pragmatism had to coexist long before AI became a household word. He can be reached via the JMP Community or on LinkedIn.
Episode 1 of 5 • Next: AI enters the classroom — opportunities for instructors
You must be a registered user to add a comment. If you've already registered, sign in. Otherwise, register and sign in.
- © 2026 JMP Statistical Discovery LLC. All Rights Reserved.
- Terms of Use
- Privacy Statement
- Contact Us