It begins innocently enough. You’re sitting in your posh office, happily typing away on your computer, powering through your latest awe-inspiring statistical analysis on your favorite statistics software (which is JMP, of course). You’re in your happy place.
There's a knock at the door. You look up to see a client standing with a stack of papers by their side. Always eager for a new problem, you ask politely, “Hey, there! How can I help?”.
“I have a quick question,” they reply.
“Go for it!” you quip naively.
And then it happens. The words shoot from their lips like arrows toward your unwitting ears.
“How many samples do I need to-?”
“GAAAAAHHHHH!!!!”
"I can only afford five. Is that enough?"
"GYAAAAAAAAAAHHHHHHHHHH!!!!!!!"
OK, so maybe I’m being a bit over-dramatic here, but many of us know this seemingly simple question – how many samples do I need? – can be a very difficult one to answer. There’s a lot of extra information you need to factor in. What effect size are you looking for? How “noisy” do you think the population is? What type of data will be collected and how?
While the answer may not be as straightforward as researchers would like, it is a vitally important one to ensure that resources are used efficiently. Too little data means you can’t make valid inferences. Too much data is wasteful. So how do you find the right balance?
The most common tool for answering this question is a power calculation. As a refresher, statistical power is the probability of detecting an effect of a certain size assuming it actually exists. One important tool available in JMP to help with this question is the Power and Sample Size Calculator. It gives you calculators for common scenarios, enabling you to generate sample sizes and/or power with ease. In some cases, you can even generate a power curve to explore the power/sample size relationship.
The Power and Sample Size Calculator is certainly a useful tool. But, to borrow a phrase from a recent film character, while it is good, it can be better. To start, it is a calculator. It's purpose is to get you an answer quickly. But power calculations should almost never be one-and-done. As with design of experiments in general, a key component to power and sample size calculations is exploration of several options. The best test plans are the result of considering different scenarios, ensuring your study is robust to unforeseen circumstances. That's not necessarily easy to do with a calculator. Something new is called for...
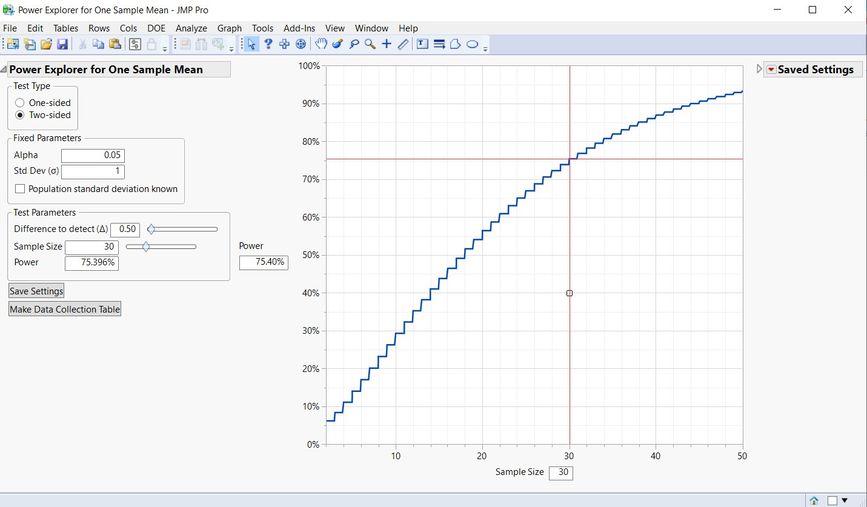
Introducing the new Sample Size Explorers in JMP 16!! Take a look (ooh's and aah's are welcome):

So what's so new? Well, for one, it's there in the title. Sample Size Explorers are created not just to help with power calculations, but to encourage exploration of the relationship between power, sample size, and other key metrics involved. Let's dive in and see what else is new!
It's All About Interaction
First, there's an improved layout that's all about interactivity. On the leftmost side, you have your control panel. This area contains all the information you need to set up your calculations. Are you doing a one-sided test or two-sided? Is this a two-sided interval or a one-sided bound? What's the alpha? Sigma? Demonstration time? If you know it, this is where you put it. And if you don't know it, that's OK. You can start with the default values provided and change them later.
Next, just to the right of the control panel, is the interactive graph. Yes, you read that right. This isn't just a simple visualization; it's OK to touch this picture. See that white square attached to the red line? You can click that "handle" as we call it in the biz and drag the crosshairs up and down the curve. The power and sample size boxes will update accordingly. Or, if you're the daring, adventurous type, you can click anywhere in the graph and watch the handle come to you! The curve will also change based on the other inputs you give into the control panel. In short, you have multiple ways to explore different scenarios, each with their own level of interactivity.
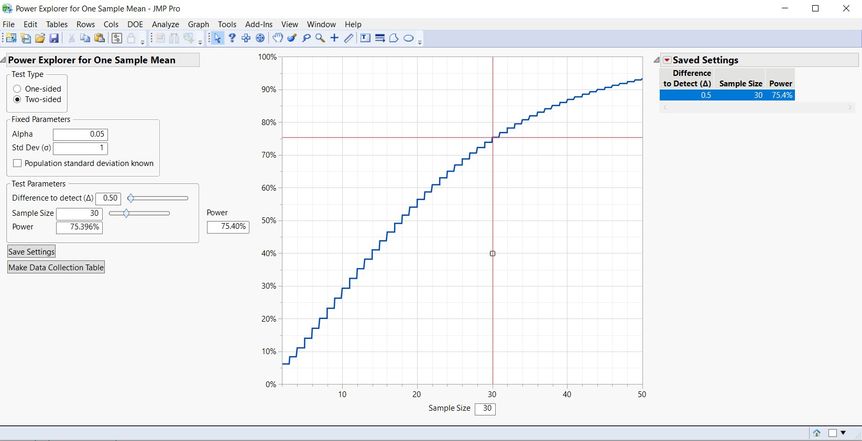
Finally, on the far right is the saved settings table. "But Caleb," you might say, "there's no table there!" True, there's nothing visible...yet! If you look in the bottom left corner, you'll see a button labeled "Save Settings". As you can probably guess, if you were to click that button, you'll get the following result:

Yep, anytime you want to save a particular scenario, simply click that button, and it will add another row to that table. Which, by the way, isn't just any ordinary table. You'll notice that one of the rows is highlighted. If you click another row, it becomes highlighted, and everything changes to reflect that scenario! So now, you can save several scenarios of interest for exploration later. You can even export the scenarios into their own data table through the red triangle menu!
A Wide Array of Possibilities
With Sample Size Explorers, power exploration is just the tip of the iceberg. There are explorers for interval calculation and even reliability demonstration. In fact, here's a list of all the available Sample Size Explorers coming out in JMP 16:
- Power
- Power for One Sample Mean
- Power for One Sample Proportion
- Power for One Sample Variance
- Power for One Sample Equivalence of Means
- Power for Two Independent Sample Means
- Power for Two Independent Sample Proportions
- Power for Two Independent Sample Variances
- Power for Two Independent Samples Equivalence of Means
- Power for ANOVA
- Confidence Intervals
- Margin of Error for One Sample Mean
- Margin of Error for One Sample Proportion
- Margin of Error for One Sample Variance
- Margin of Error for Two Independent Sample Means
- Margin of Error for Two Independent Sample Proportions
- Margin of Error for Two Independent Sample Variances
- Reliability Demonstration
- Parametric Reliability Demonstration
- Nonparametric Reliability Demonstration
At JMP, we're all about statistical discovery, and Sample Size Explorers are yet another tool to help you along the way. So what are you waiting for (besides your chance to update to JMP 16)? Get out there and start exploring!!