 Hello! Welcome to today's Need for Speed! It's all about filtering and subsets.
My name is 2-Click Clovis, and I am truly passionate about data analysis and most important, time efficiency! JMP was an integral tool for my previous work in the semiconductor and manufacturing industries. Since joining JMP, I have learned so many new tips and tricks. I’ll never forgive myself for not knowing what I now know, because I could have saved so many hours in my data analysis workflow! I see it as my current responsibility to share my newfound knowledge with data analysts to help them regain their precious time.
After I demonstrate how quickly JMP can perform your routine data manipulation and analyses compared to other tools, I’ll show you the quickest way to get it done within JMP.
Filtering data by one variable
One of my favorite features in the newer versions of JMP (beginning with JMP 15) is the histogram icon in the top left corner of your JMP table.

This histogram icon allows you to easily filter your selection of data by one variable with just two clicks! With your first click, click on the histogram icon. BOOM! Histograms appear beneath each of your column names. If your variable is continuous, you see its minimum and maximum values displayed on the histogram. If your variable is categorical, you see the number of values/levels for that variable and their relative count.

With your second click, select a value or range of values directly on the histogram. BOOM! Notice that all the rows associated with your selection are now highlighted. This is an example of JMP’s famous dynamic linking! In the animation below, watch as I click on the histogram icon, then click on the “Reject” value under the Lot Acceptance column. When I do this, all the rows associated with “Reject” are highlighted (14 out of 90 rows).

You can now easily create a new subset table based off this selection by going to Tables>Subset>OK. In the animation below, you can observe the creation of a new subset table with just the 14 “Reject” rows.

Filtering data by more than one variable
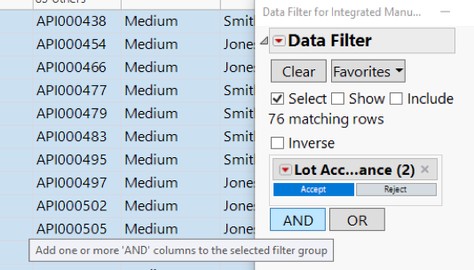
To filter data by more than one variable, I recommend using JMP’s Data Filter. All you need to do is go to Rows>Data Filter or just click on the following icon:

You can then double-click on a variable of interest and select a desired value or range of values. To incorporate more variables, click either the “And” or “Or” functions at bottom.

In the animation below, you can see how to create a subset based off the following conditions: Sugar Supplier equal to “Sour” and Mill Time between 10 and 20.

Local data filtering within a JMP graph or report
All JMP reports are going to have an option to add a Local Data Filter under the red triangle at top left of report. This tool is a great way to answer any “What would this look like if…” questions. The best part is that you do not need to recreate your reports or graphs! In the example of the animation below, we are looking at the Dissolution box plot. What would the box plot look like if we were only looking at “Sour” Sugar Suppliers and “Smooth” Talc Suppliers?

On that note,

is clicking out!
Tablet Production Need for Speed.jmp
Tablet Production Need for Speed.xlsx