At the end of 2018, we quietly rolled out the new version of JMP Clinical to existing and potential customers. Now we want everyone involved in clinical trials data review and analysis to know what they can get from JMP Clinical 7. Particularly at biopharmaceutical organizations, medical universities, regulatory agencies and CROs, we intend to show doctors, data scientists, data managers and medical writers that, if they put in their clinical trials data, they can get any of over 60 valuable reports packaged in a dashboard in a matter of seconds. This current release is the first foray into developing reports for a specific therapeutic area, oncology. Here are a handful of examples to see what is new with this release.
Clinical data scientists and medical doctors have oncology-specific views
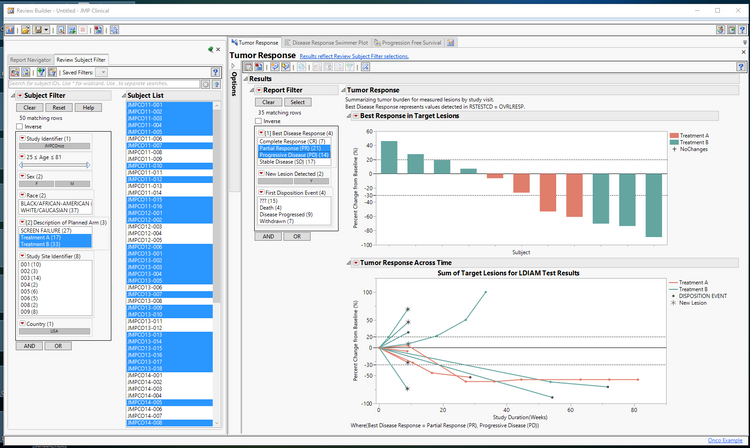
Oncology-specific views for clinical data scientists and medical doctors help in assessing the safety and efficacy of the participants in clinical trials. The expectation here is that they follow the RECIST 1.1 or irRECIST guidelines. These include a Progression Free Survival report, Swimmer plots and a tumor response report, shown below, that allow clinical data scientists and medical doctors to simultaneously observe the patients’ overall response, in terms of percent shrinkage of tumors, along with each individuals’ shrinkage over time with indications of new lesions as well as any other dispositions such as death or discontinuation from the trials. You can use these reports directly in scientific journals to to share results on an ongoing basis. JMP Life Sciences R&D manager Dr. Kelci Miclaus provides a more in-depth description of these new reports in a webinar you can watch on demand: Visualization and Analysis in Oncology Trials Using RECIST.
 Tumor response report for oncology studies
Tables in adverse event narratives for medical writers
For medical writers, there are more out-of-the-box narrative templates, including the most requested “By Subject” organization of adverse events. These templates simplify the writing of narratives for the clinical study report, helping fulfill the ICHE3 guidelines to create narratives for deaths, other serious adverse events, events leading to discontinuations and adverse events of special interest. The “By Subject” template, as its name implies, starts with the subject's medical history and other summary information presented first, and then each adverse event is listed chronologically indicating medications, relatedness to the drug, outcome and other details specific to each event. What follows is the first page of a patient narrative generated by JMP Clinical.

Medical reviewers can filter on demographics or other data
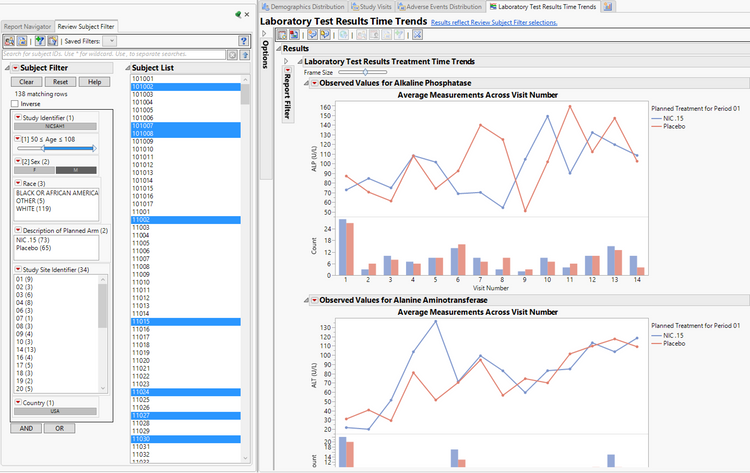
Medical reviewers get the convenience of the "Review Subject Filter," utilizing the updated Virtual Join enhancement in JMP 14. This enables medical reviewers to filter all reports simultaneously based on demographic criteria, as well as details within each specific report for safety, efficacy or statistical monitoring. You can see this in action in the graphic below, where males who are over 50 are filtered in the Laboratory Test Results Time Trends, Demographics Distribution, Study Visits and Adverse Event Distribution report simultaneously (Laboratory Time Trends shown).
 Males who are over 50 are filtered in the Laboratory Test Results Time Trends, Demographics Distribution, Study Visits and Adverse Event Distribution report simultaneously.
More metadata for data managers
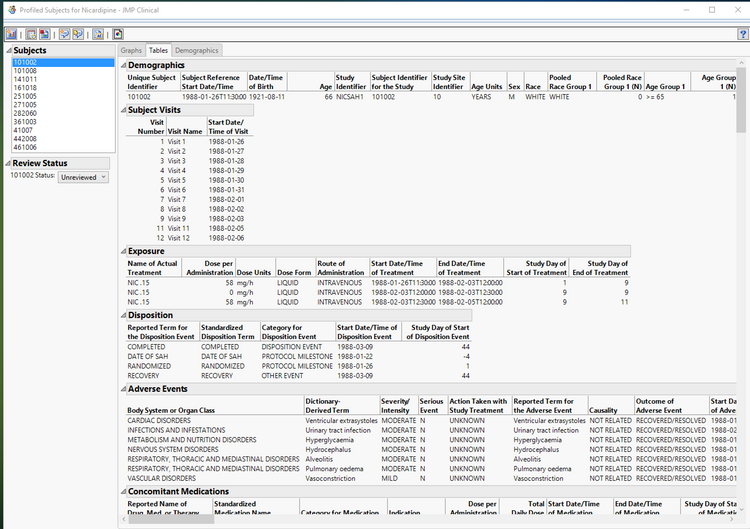
Data managers who use JMP Clinical have access to more metadata about the studies and more control over the data that is included in the reports. In particular, you can configure the patient profiles to include any relevant variables that are deemed important to appear in the profile tables, with control over the sort order as well. This eliminates the need to incessantly program variations of these output tables and puts the control in the hands of the end user.
 You can configure the patient profiles to include any relevant variables that are deemed important to appear in the profile tables.
Clinical operations professionals can determine cause of outliers
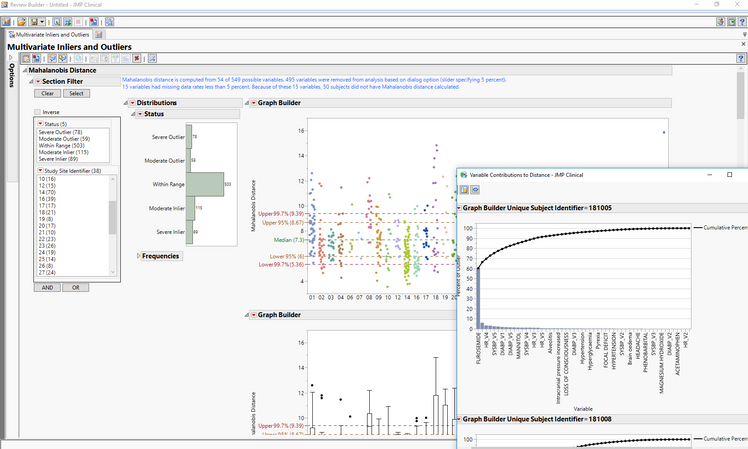
Finally, for clinical operations personnel involved in central statistical monitoring, the updated report for Multivariate Inliers and Outliers reflects the need to determine which variables are contributing most to a subject's appearance as an inlier (too similar) or outlier (too different) based on a Mahalanobis distance (overall difference compared to the “statistically average” patient). By selecting a point or points on the graph, you can isolate the subject(s) of interest and drill down to investigate which demographic information, events, findings or interventions led to them being a severe or moderate inlier or outlier.
 By selecting a point or points on the graph, you can isolate the subject(s) of interest and drill down to investigate which demographic information, events, findings or interventions led to them being a severe or moderate inlier or outlier.These and many other features are new and enhanced tools for those reviewing clinical trials data. For a quick introductory video of JMP Clinical, visit our the JMP Clinical website. For a more comprehensive list of what is new in JMP Clinical 7, view the release notes for the software. For more on-demand videos of JMP Clinical and JMP in the life sciences, please visit the Life Sciences On-Demand Webinars page.
You must be a registered user to add a comment. If you've already registered, sign in. Otherwise, register and sign in.