cancel
Showing results for 
Show  only  | Search instead for 
Did you mean: 
Try the Materials Informatics Toolkit, which is designed to easily handle SMILES data. This and other helpful add-ins are available in the JMP® Marketplace
Choose Language Hide Translation Bar
XanGregg
Staff
How to create an axis break in JMP

I’ve been asked three times this year about how to make a graph in JMP with an axis break. Before I show how, I want to ask “Why?” The obvious answer to “Why?” is “to show items with very different values in one graph,” but that’s a little unsatisfying. I want to know why they need to be in one graph. The advantage of a graphical representation of data over a text representation is that we can judge values based on graphical properties like position, length and slope. However, once we break the scale, those properties are no longer as comparable. We effectively have two separate graphs after all – which is actually how we can make such views in JMP.

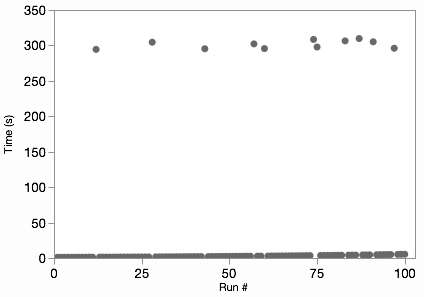
Related to my “Why?” inquiry, I’ve had a difficult time finding a compelling real-world example to illustrate an axis break, so I made some hypothetical data. Say we have timing values for a series of 100 runs of some process. Usually, the process takes a few seconds per run. But sometimes there’s a glitch, and it takes several minutes. Here’s the data on one graph (all on one y scale).
 

TimesWhole


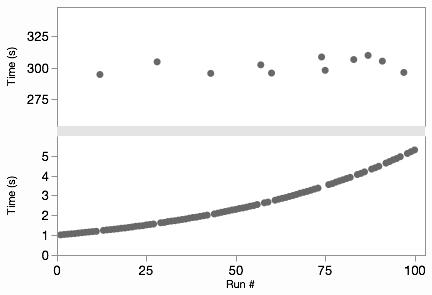
We can see where the glitches are, but we can’t see any of the variation in the normal non-glitch runs. Some would also object to the “wasted” space in the middle of the graph. However, those aren’t necessarily bad attributes. The non-glitch variation is lost because it’s insignificant compared to the glitch times, and the space works to show the difference. Nonetheless, if our audience already understands those features of the data, we can break the graph in two to show both subsets on more natural scales.
 

TimesBroken


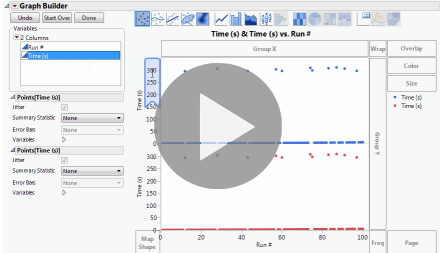
Now we can see that the non-glitch times are increasing on some curve. The “trick” in Graph Builder is to add the variable to be split to the graph twice in two different axis slots. Then we can adjust the axes independently, perhaps even making one of them a log axis. The Graph Spacing menu command adds the spacer between the graphs to emphasize the break. It’s easier to show than explain, so here’s an animated GIF of those steps.
 

playAxisBreak


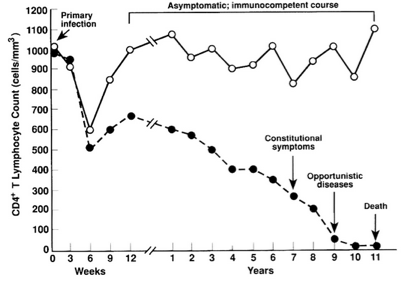
I skimmed a few journals looking for examples of broken axes. Here’s an example of a pattern I saw a few times for drug treatment studies where the short-term and long-term responses are both interesting. This graph is from Annals of Internal Medicine and shows two different groups’ responses to an HIV treatment.
 

HIV Treatment 1


Each side of the axis break uses different units of time, which fits perfectly with the idea that there are really two separate axes. One thing that bothers me about this graph, though, is the connection of the lines across the gap. Notice the difference in my JMP version:
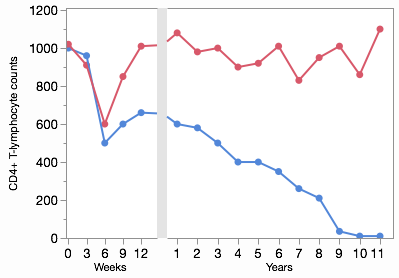
 

HIV Treatment 2


With different x scales, the slopes should be different. That is, the change per week (slope on the left) should be flatter than the change per year (slope on the right) for the same transition. Fortunately, Graph Builder takes care of this for you, but it’s something to be aware of when you’re reading these kinds of graphs in the wild.


The broken line from the HIV study is an example of how an axis break can distort the information encoded by the graphic element. A more serious distortion occurs when bar charts are split by a scale break since the bars can no longer do their job of representing values with length. I’m not even going to show a picture of that. Never use a scale break with a bar chart.


When making graphs with scale breaks, make sure each part works on its own, because perceptually they really are separate graphs.

Last Modified: Sep 28, 2017 11:59 AM
Comments
WP_Comment
Visitor

Michael Clayton wrote:

Thanks. Keeping it simple to tell short term and long term story is not easy but your thoughts help.

Graph Builder vs Fit Y by X is tough choice some times due to ease of Graph Builder, but augmentation tools for Fit Y by X to add stats tables, comparisons, etc. Will Graph Builder evolve in that direction? Same issue when trying to do Variance Components graphically and statistically.

The Variability Plot is great (and I almost never use it for gage studies. mostly for Varcomp-type studies on EDA or DOE efforts. Graph Builder does graph reasonably, but not % explained by nested factors.

XanGregg
Staff

Xan Gregg wrote:

Thanks. Good question about Graph Builder in general (could make an interesting discussion in the JMP Community). We're certainly looking in that direction to close the gap you point out though we have to do it a manner than keeps the spirit of Graph Builder.

WP_Comment
Visitor

BG wrote:

Thanks for your insight but I think you may be missing the point about needing to create a break in a bar chart. This becomes handy when for example, you are looking at patient treatment groups when testing a drug. One group is placebo, the other 3 groups are 3 different types of treatments. You are looking for patients' response and looking at serum levels of a particular drug. In A LOT of cases, a treatment group may show something like 1,000x higher levels than the rest of the treatments (i.e. placebo = 15 mg/dL, treatment 1= 25, treatment 2= 50, treatment 3 = 1000. A bar graph that has a break at 100 will elucidate that differences between placebo, treatments 2 and 3. Without the break, it will be hard to show the differences between those treatments since the scale up to 1000 will merely show those low values in the picture.

ghartel
Level III

I need to do this for a survival curve for parasites.  Some die off in the first few minutes, then the rest die off the next day.  So I don't want a straight line going across most of the plot and the actual differences compressed at either end.  The above trick doesnt work because I'm not using Graphbuilder.  The closest I can get is to do the survival plot twice, one scaled to show the front of the curve, the second to show the tail of the curve, and then combining the two plots in a new window, eg:


nw = new window("Survival Plot",h list box(Align(Center), s1[ListBox(4)], s2[ListBox(5)] )) << Journal;

(using JMP 13.1.0)

When I export it though, it is jsut 2 plots next to each other, rather than a single plot with a split axis.


Any advice how to better that?


jdbartx09
Level I

Thanks for the post XanGregg. Super helpful for me. I come across cases quite oftern where I need to break the horizlontal axis as you did in the HIV treatment example. In my case I am plotting data across a frequency range that is quite large, however only specific frequency bands have any y-data. Thus, I skip the frequencies which don't have any data to show. I do have one question regarding the JMP plot for the HIV treatment...


How did you manage to create indepent sizes for the left and right side of the plot? 


Thanks in advance. 

XanGregg
Staff

Thanks for the comments @jdbartx09. To make one graph smaller than the other, there is a resize hotspot between the two axes.


resizehotspot.png


BHarris
Level VI

I didn't realize you could shrink one of the graphs when two are side by side, so I went into JMP v17 to try it, but resizing the left plot (with the handle on its right edge) also resizes the right plot.  Is there a trick to this?

shampton82
Level VII

@BHarris I just tired it and if you hold down control while you resize the left panel it will break the symmetrical resize default.  Which is awesome as I have wanted this for a long time!


Steve

BHarris
Level VI

@shampton82 : Which version of JMP are you using?  I just tried v17.0 and it doesn't work.  Dragging the bottom-right corner of the left plot symmetrically resizes both plots for me, regardless of whether control is held down or not.

shampton82
Level VII

@BHarris Interesting.  I'm using 17.2

XanGregg
Staff

Important detail: the hot spot for this is between the axes, not between the graphs.

BHarris
Level VI

Yes, I discovered that.  At this point, I can't make it work on JMP 17.0 (Windows), and I can't make it *not* work on JMP v17.2 (Mac).

scott1588
Level IV

I have often tried to resize one panel on graph builder with the hotspot on graph builder and have never been able to get it to work. Using JMP 17.2 on a Mac.