A baby sea turtle that has just hatched
I spend a fair amount of time at the North Carolina coast, specifically at Oak Island. Over the years, I’ve noticed the attention given to saving the sea turtles, but I didn’t get involved with this endeavor until the summer of 2014.
I happened to witness a nest hatching with my mom one evening, and it was amazing to watch all those tiny turtles emerge and march to the water. Did you realize as many as 50-350 hatchlings emerge from one nest? Did you know that only 1 in 1,000 survive?
And so it began for me. I learned more and more about sea turtles: nesting, hatching, survival rate, types of turtles, etc.. After taking a new job as a JMP software tester, I found out I could use sea turtle data to do my testing. That led to some discoveries in the data and a poster presentation at Discovery Summit 2015 in San Diego in September.
JMP did a wonderful job of reading the data in for me, using the File > Internet Open option in JMP. After that, I was able to pull statistics together with Formula columns, and concatenate tables together for several years. That let me look for trends over time and make some comparisons. Graph Builder and other platforms, such as Distribution and Fit Y by X, allowed me to find hatching and nesting trends for Oak Island, specifically in areas where there was greater nest density.
For example, here are the summary statistics on all of the nests from the 26 beach programs, showing the hatching success from 2010 to 2015. Hatching success is the number of eggs that actually hatch from a nest. I had 2015 data only through August 15.

Summary statistics of hatching success
As you can see, the mean hatching success is about 78 percent.
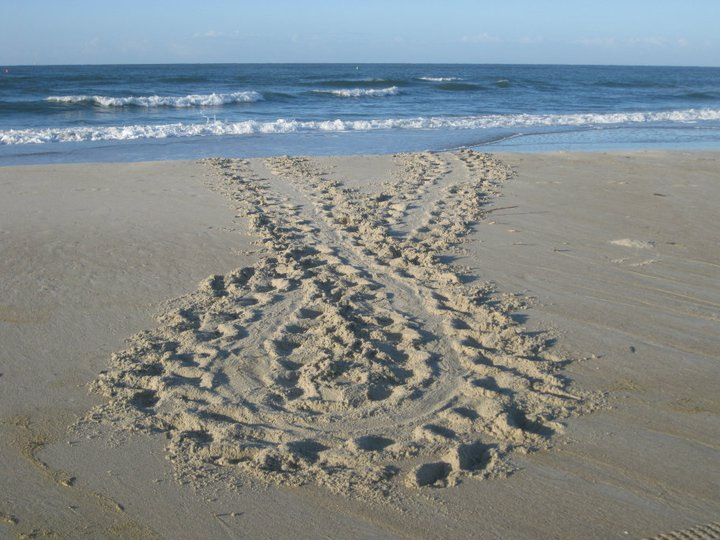
Sometimes, a sea turtle emerges from the water to lay her nest, but then for some reason changes her mind and returns to the water. That’s called a false crawl (see below).

Tracks left behind from a false crawl by a sea turtle.
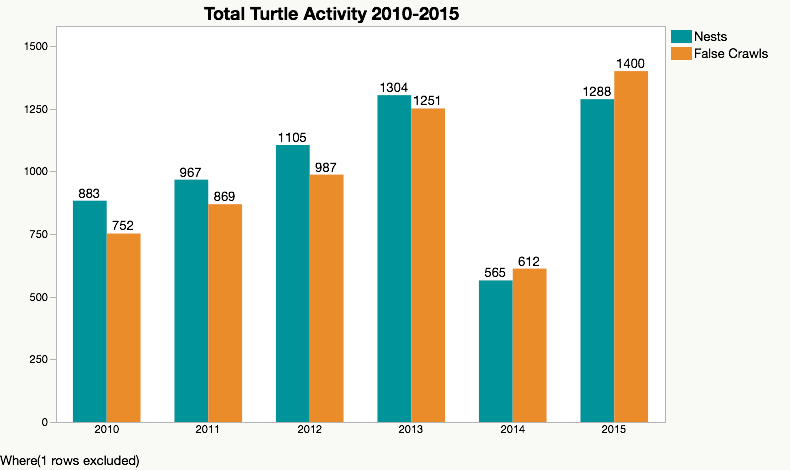
Using Graph Builder, I saw that nests laid and false crawls are closely correlated in any given year. This bar graph shows the totals for the years 2010-2015:

Nests and false crawls, 2010-2015
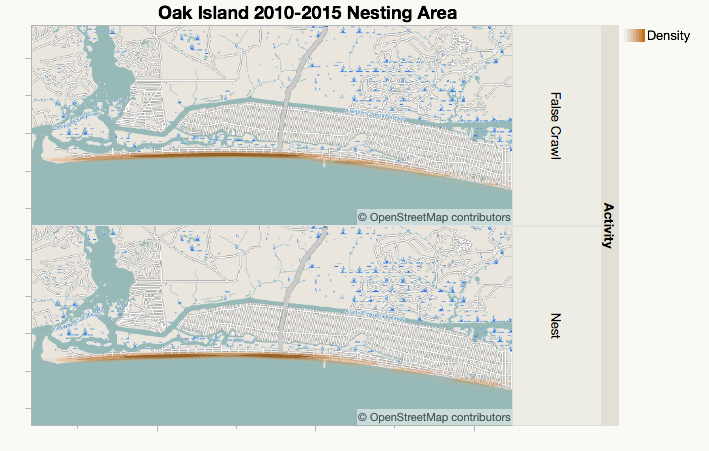
Having the latitude and longitude points of all the nests from 2010 to 2015 enabled me to plot the points with Graph Builder, and then use the Street Map Service in the background to produce this density map:

A density map of sea turtle nests at Oak Island
Recently, I shared these findings and visualizations with the NC Wildlife Sea Turtle project leader, who suggested that I share my analysis with volunteers next spring to open the new season. And I will do that, after I complete my analysis for 2015!