cancel
Showing results for 
Show  only  | Search instead for 
Did you mean: 
JMP is taking Discovery online, April 16 and 18. Register today and join us for interactive sessions featuring popular presentation topics, networking, and discussions with the experts.
Choose Language Hide Translation Bar
Cycling up a mountain with design of experiments

Inspired by Peter Polito’s blog series about DOE-ing his running, I decided to do the same thing with cycling. I had a few questions about biking performance, and I think design of experiments (DOE) is a great way to answer these.

My questions:

  1. How much does the bike affect performance?
  2. Does drinking a beer the night before a ride influence riding performance?
  3. Should I eat before a ride to increase performance?

So let's see what we can learn with DOE.

The Ride

Before I get to these questions specifically, let’s talk about the ride. Cycling up a mountain 12 times (seems ridiculous) to test out performance really helped me appreciate the value of each run in a DOE. The mountain in question is Lookout Mountain, which is perched above Golden, Colorado. Rising nearly 1,300 feet (400m) in about 4.5 miles (7.25km) to add to the challenge, the climb starts at an elevation above 6,000 feet (1850m). For fans of cycling, this is a class 2 climb, which is a mere speed bump for professional riders. For an out-of-shape amateur such as myself, the climb is a long, unrelenting test of will. Here is a snapshot of the ride map and profile.
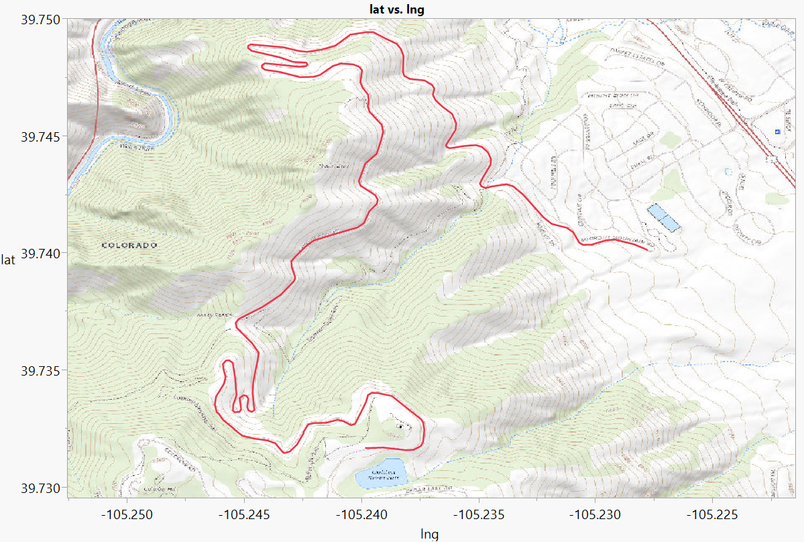
 

Bike blog pic 1.pngBike blog pic 2.png

In the first picture, I am at the base of the climb trying to look excited about Tabletop Mountain stretching above me in the distance. In the second picture, I am much happier at the top of the climb, and it's hard to blame me with that view.

bottom of climb.jpgtop of climb.jpg

I have always wanted to know how a bike affects performance, and I have never seen a well-designed experiment to measure the impact. Bikes can increase dramatically in price with lower weight and higher quality components, but how does this impact your performance? To test this, I am going to use two bikes. One is more of a performance road bike, and the other is more of a commuter bike. Here is the tale of the tape for these two bikes.


Bike chart 2.JPG

*Bikes were weighed with no water bottle on my bathroom scale by my entire family twice; the mean weight is reported. Yes, I ran a measurement system analysis on my bathroom scale. The good news is the scale is not supplying much extra variability, and my son might have a future in testing parts.

Bike blog pic 3.pngBike blog pic 4.png

To give you an idea of road bike weights, I asked a couple of colleagues for their road bike weights, and I got a range of 19.5-22 pounds for bike weights. The point is that I have a light road bike and a heavy road bike to use in this DOE. I really like my bikes, and I want to put them to the test.

The DOE

I set this up as a functional DOE as I want to measure my heart rate and speed throughout the ride. My other response measured was climbing time, which I called pillars to post time (there are pillars at the start of the climb and a post at the end). I also recorded the weather at the start of the ride, my weight before the ride, days since my last ride, and if I had gone for a run between rides. I attempted to space the rides either two or three days apart, and have the rides start around the same time in the morning. I set up the DOE in JMP with a random block factor to group these rides into weeks in case my performance improves during the DOE. The DOE with results is shown in the data table below.
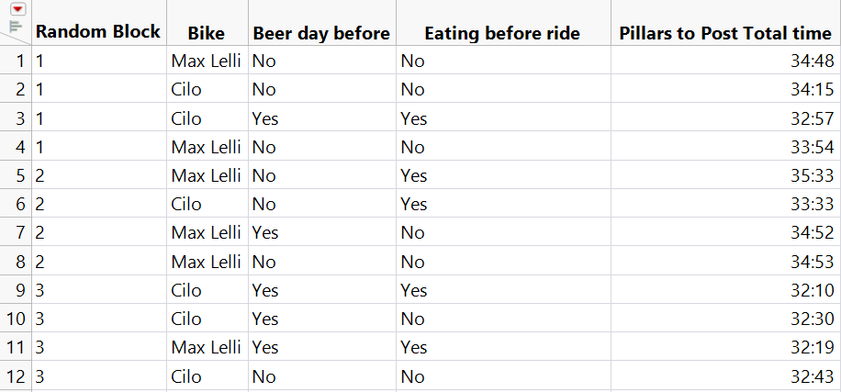
 

Bike blog pic 5.png

The Results

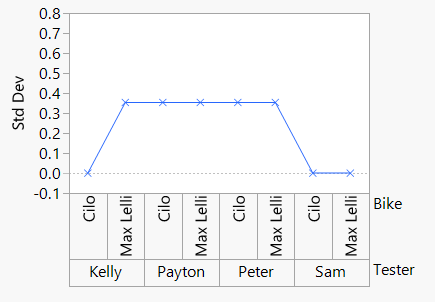
Upon completion of my DOE, I ran the REML model that was generated from creating the DOE. I found that two of my factors turned out to be weakly significant with a pretty good model fit to predict climbing time. It also looks like my time was improving during the DOE, but the random blocking factor (or week of the ride) was not statistically significant. This can be seen by the REML Variance component Estimate report. The p-value is too high to indicate statistical significance, and the confidence interval contains 0.

Bike blog pic 6.pngBike blog pic 7.png

Question 1: How does my bike affect my performance?

Amazingly, I consistently rode the Cilo, my nearly 23-pound commuter bike, up the mountain faster than my Max Lelli. The nearly 5.5-pound difference did not have the impact I was expecting. This gives more credence to legendary cyclist Eddy Merckx who says, “Don’t buy upgrades, ride up grades.


Bike blog pic 8.png

Question 2: Does drinking a beer the night before a ride influence my riding performance?

Another surprising result: I tended to ride up the mountain faster if I had a beer the night before. Who knew that alcohol could be used as a performance-enhancing drug?

Bike blog pic 9.png

Question 3: Should I eat before a ride to increase performance?

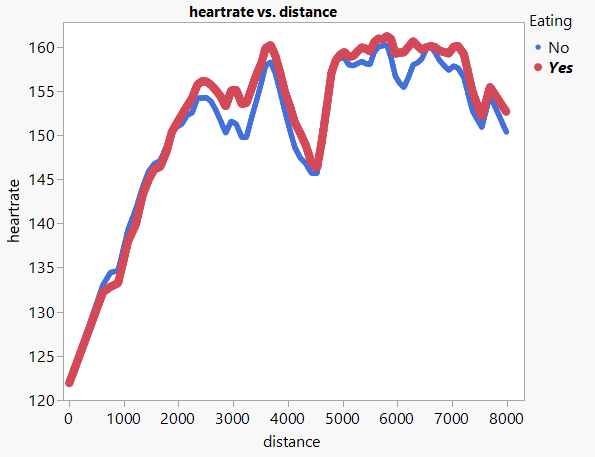
Eating before the ride did not impact my ride time up the mountain significantly, but it did have an impact on my two functional responses: heart rate and speed. Below is a graph of my average heart rate by distance into the climb based on whether I eat before the ride or not. With eating, my heart rate tends to be higher and stay higher longer.
Bike blog pic 10.png

This graph shows my speed profile during the ride. As you can see, eating has an impact on the profile even though it does not have an impact on the overall time.

Bike blog pic 11.png


Conclusion

I had a lot of unexpected results, finding that a heavier bike and having a beer the night before actually improved cycling performance. While snacks did not impact my time, they did lead to an overall higher heart rate and a different speed profile. All in all, I think the experiment was a success. Now I can let my wife know that I need a beer tonight because I plan to go for a bike ride tomorrow. Cheers!

Last Modified: Oct 11, 2021 10:07 AM
Comments
dara_hammond
Staff

What more proof does one need!?  Fun experiment @Peter_Hersh, as always!

Peter_Polito
Staff
What awesome findings! To what do you attribute the faster/heavier bike? Downhill speed is all I can come up with. And maybe the beer gets you to sleep faster and you're overall more relaxed. Either way, it looks like a beer drinking DOE is in your future.
Peter_Hersh
Staff

@Peter_Polito, great question.  The time is actually just the ascent, so the descent is not playing into the improved time.  I think two things might be playing a role.  The gearing and the seat position.  The gearing on the Cilo did not have a gear that was as high as the Max Lelli.  The Cilo also had a slightly larger frame, which might have been beneficial.

SimonW_14
Staff

@Peter_Hersh what a fun way to demonstrate DOE and subsequent analysis. And those times given the distance and elevation gain (and the starting altitude) are very good! Thanks for taking the time to do the hard work and share your findings.


Would you be able to fit a power meter :) that is interchangeable between the bikes so as to look at your power output? I would have thought that your Cilo is requiring extra watts going up the hill compared to the Lelli because of the extra weight of the bike. If you rode to the same number of watts on both bikes, then i would think the Lelli would get a better time?


Other suggestions (if you have time/money/inclination):


Could the fact that your gear ratios are slightly different, be playing a part in you generating more power for the Cilo? Assuming you are in the smaller chain ring in the front for both bikes and you ride to the same cadence on both bikes, then i think you will always generally deliver more power on the Cilo? Even though both bikes have a 26 sprocket on the rear cassette, the front chain ring for the Cilo is 42 whereas the Lelli has a 39.


If you had the same cassettes in terms of sprockets and front chain rings on both bikes, then i wonder if the difference may swing towards to the Lelli? But that requires some major bike changes to one of your bikes :)

robyngodfrey0
Staff

Would love to do this experiment with running!

Stroget
Level I

Too many uncontrolled secondary factors, perhaps.  Like gearing and frame size as pointed out.  Did you drink the same beer every time?  What kind? - I need to get me some!    This is a great DOE/bike story - I may steal it!  :)

Peter_Hersh
Staff

@SimonW_14,  Using a power meter/cadence monitor was the original idea, both were going to be functional responses.  The monitor I purchased attached to my shoe, so I could easily use with both bikes.  On a couple of trial rides with the sensor, it did not stay connected to my phone very well lots of missing data.  I ended up returning it and was disappointed that I did not have that information.  I would suspect that you are correct that on the Cilo I am generating more power on average due to larger small chainring.  The last week of riding, which had the best times I spent more time out of granny gear and it seems to show.  I might try a different power meter in the future, but for now, I am going to do less structured riding.

Peter_Hersh
Staff

@robyngodfrey0,  You should read @Peter_Polito's blog on running.  It was my inspiration. DOE-ing Myself: Using design of experiments to run more efficiently  If you would like help setting up a DoE I would be happy to help you out.


Peter_Hersh
Staff

@Stroget ,  You are probably right on the uncontrolled factors.  Ideally, I would have a few more rides and a power monitor that worked properly.  For my beer drinking before rides, it was one or two IPAs the night before.  Roughly 9-10 hours before the ride.  My retired colleague @P_Bartell always used to say steal and improve.  He would also like the bathroom scale MSA.  

P_Bartell
Level VIII

@Peter_HershActually, it was 'snatch and improve'...but you got the gist. And the bathroom scale MSA is a must even before you begin experimentation. My current scale has some sort of 'memory' that I can't shake. If I get on and off at very short time intervals, it's a digital readout, and the number, down to the 0.1 lb. NEVER varies. Not even by 0.1 lb. I find that hard to believe so I think there is some logic in the controller behind this lack of repeat measurement variation. Because we all know, "All work is a process. All processes are variable. And we use data to make decisions or guide action." Two Peter Bartellisms in one thread post. Signing off for today.

Stroget
Level I

Great conversation - I love DOE and Biking both!

Peter_Hersh
Staff

@P_Bartell funny I don't trust my bathroom scale either.

beverlybrown
Staff

What a fun analysis! I notice you're smiling more broadly at the summit. In this paper on sports nutrition, an old coach of mine recommended eating pizza before road races: http://ommolketab.ir/aaf-lib/cywpp8jo4rt55qk5ci60zsui5q775l.pdf We're all an experiment of one...

Paulswinand
Level I

a very interesting analysis: I'm curious, is there any reason you didn't measure watts to see if you actually just pedaled harder on the days you rode the heavier bike? Also, was your perceived effort 100%/equal on every run?


cheers


Paul Swinand

Paulswinand
Level I

I see the prior posts that you tried power. The wheel based systems would allow you to swap rear wheels, although you'd need all same cogs

Paulswinand
Level I

another interesting physiological test on the beer would actually be the time it was consumed, and some measure of sleep depth

YvesJMP
Staff

I am not surprised at the results for eating and beer. Having 1 beer the night before the effort is helpful as alchohol serves as a tertiary source of energy. Not eating before a ride always helps me feel better during the ride, so showing a lower heart rate is logical to me. It would be interesting to see how many hours prior to the ride the beer actually helps. 


Peter_Hersh
Staff

@beverlybrown absolutely I was very happy at the top of the summit.  I am not sure if pizza would help, but I would be willing to try that out.  Also a very good point what works for me won't necessarily work for others.

Peter_Hersh
Staff

@Paulswinand,  Yes watts was absolutely the plan to begin, but the sensor was an issue.  I could not switch rear wheels out for this experiment with the different components sets.  I felt at the end of each of these climbs that I was completely taxed or had given 100% effort.  I might have been able to shave off a few seconds, but I don't think I had much left.  That brings up one of my other favorite biking quotes from Greg LeMond "It never gets easier, you just get faster".

Peter_Hersh
Staff

@YvesJMP, I attempted to keep my spacing of beer consumption to ride roughly 10 hours.  I would have a beer at 9 pm then start the ride at 7 am.  That would vary but it would be relatively consistent.  Maybe there is an ideal spacing between beer drinking and riding.  Also, the type of beer might play a role as a double IPA might have a different impact than a Lager.


I think the consensus is sleep monitoring would be a good thing to pay attention to next time.  If you and @nick_shelton want to take an RV trip down to Colorado we can test it out.

eranse
Level II

Great experiment - Thanks for sharing.

being a statistics novice - I am interested in the graphs of HR and speed versus distance by eating or not. Is there a way to quantify the difference in the means of these trends? are they really different or do they just visually seem to be?


Peter_Hersh
Staff

@eranse ,  The HR and speed graphs you are seeing in the post are the mean of 6 rides each with and without eating.  The difference in shape parameters are statistically significantly different.  These parameters come from functional data analysis performed in JMP.  If you are interested in learning more.  Here is a talk that I did on the topic.

Phil_Kay
Staff

Thanks, @Peter_Hersh . That helps with the business case for me to invest in a new steel frame bike. Steel is real.

Peter_Hersh
Staff

@Phil_Kay Absolutely a very smooth ride.  After the experiment, I put 32mm tires on the Cilo, and now it is like riding on a couch.

Paulswinand
Level I

@Phil_Kay  re steel bikes: weight is highly overestimated and body weight can vary day to day 4-6 lbs based on if you eat a lot. fwiw, I race cyclocross and have a fancy carbon bike, but my only placings in the top 10 of Cat 1-2-3 in our 12 race series over the last 10 years have been on a steel single speed. So, the point being, in some situations, steel does actually work better (it is my theory the steel single speed actually had an advantage on certain courses, although these placings are not at stat sig--only 3x and now we have downward drift in results due to age :)  @Peter_Hersh there's some research I've seen on fatter tires, and if the surface is at all rougher than a velodrome, fatter tires are supposed to be faster...less forward energy lost bouncing up and down. (the research I saw was done in Sweden on 28MM tires).

Final comment on steel, the ride is also very pleasurable. New gravel bikes have geometry like old Italian race bikes (think 50-60s) or touring bikes.

Phil_Kay
Staff

@Paulswinand , a few years ago, when I used to go out on Saturday morning club rides, almost everybody was riding carbon. The cyclist that was consistently first to the top on the big climbs was riding a 1980's Peugeot steel frame. It was obvious that the weight advantage of carbon frame was negligible and rider weight was a much bigger factor.