Inspired by Peter Polito’s blog series about DOE-ing his running, I decided to do the same thing with cycling. I had a few questions about biking performance, and I think design of experiments (DOE) is a great way to answer these.
My questions:
- How much does the bike affect performance?
- Does drinking a beer the night before a ride influence riding performance?
- Should I eat before a ride to increase performance?
So let's see what we can learn with DOE.
The Ride
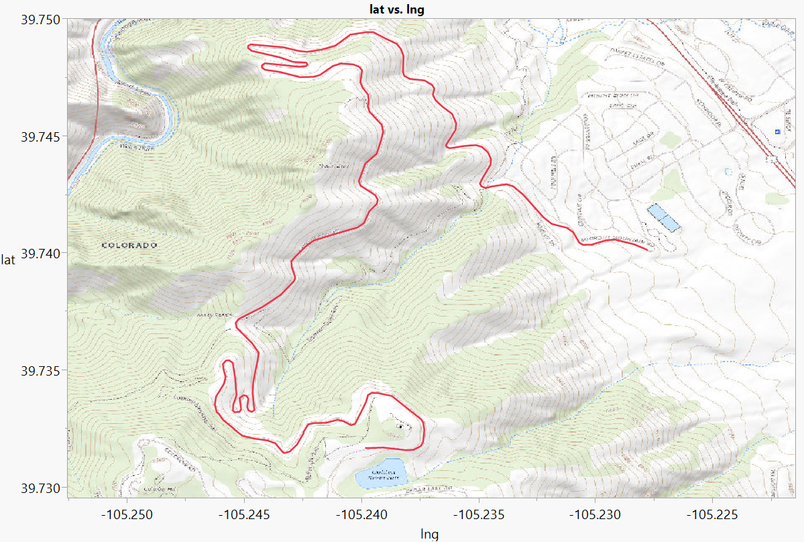
Before I get to these questions specifically, let’s talk about the ride. Cycling up a mountain 12 times (seems ridiculous) to test out performance really helped me appreciate the value of each run in a DOE. The mountain in question is Lookout Mountain, which is perched above Golden, Colorado. Rising nearly 1,300 feet (400m) in about 4.5 miles (7.25km) to add to the challenge, the climb starts at an elevation above 6,000 feet (1850m). For fans of cycling, this is a class 2 climb, which is a mere speed bump for professional riders. For an out-of-shape amateur such as myself, the climb is a long, unrelenting test of will. Here is a snapshot of the ride map and profile.


In the first picture, I am at the base of the climb trying to look excited about Tabletop Mountain stretching above me in the distance. In the second picture, I am much happier at the top of the climb, and it's hard to blame me with that view.


I have always wanted to know how a bike affects performance, and I have never seen a well-designed experiment to measure the impact. Bikes can increase dramatically in price with lower weight and higher quality components, but how does this impact your performance? To test this, I am going to use two bikes. One is more of a performance road bike, and the other is more of a commuter bike. Here is the tale of the tape for these two bikes.

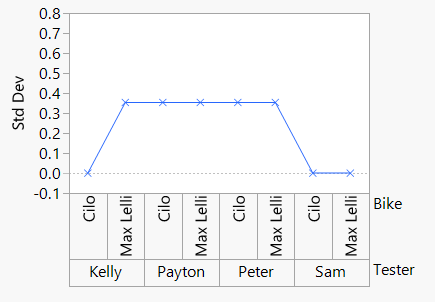
*Bikes were weighed with no water bottle on my bathroom scale by my entire family twice; the mean weight is reported. Yes, I ran a measurement system analysis on my bathroom scale. The good news is the scale is not supplying much extra variability, and my son might have a future in testing parts.


To give you an idea of road bike weights, I asked a couple of colleagues for their road bike weights, and I got a range of 19.5-22 pounds for bike weights. The point is that I have a light road bike and a heavy road bike to use in this DOE. I really like my bikes, and I want to put them to the test.
The DOE
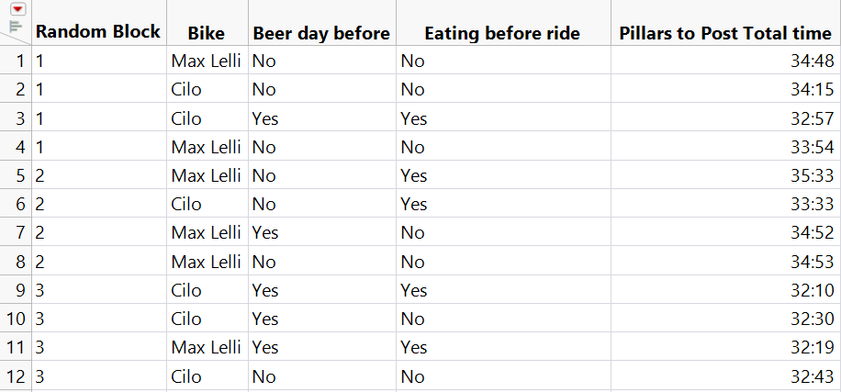
I set this up as a functional DOE as I want to measure my heart rate and speed throughout the ride. My other response measured was climbing time, which I called pillars to post time (there are pillars at the start of the climb and a post at the end). I also recorded the weather at the start of the ride, my weight before the ride, days since my last ride, and if I had gone for a run between rides. I attempted to space the rides either two or three days apart, and have the rides start around the same time in the morning. I set up the DOE in JMP with a random block factor to group these rides into weeks in case my performance improves during the DOE. The DOE with results is shown in the data table below.

The Results
Upon completion of my DOE, I ran the REML model that was generated from creating the DOE. I found that two of my factors turned out to be weakly significant with a pretty good model fit to predict climbing time. It also looks like my time was improving during the DOE, but the random blocking factor (or week of the ride) was not statistically significant. This can be seen by the REML Variance component Estimate report. The p-value is too high to indicate statistical significance, and the confidence interval contains 0.


Question 1: How does my bike affect my performance?
Amazingly, I consistently rode the Cilo, my nearly 23-pound commuter bike, up the mountain faster than my Max Lelli. The nearly 5.5-pound difference did not have the impact I was expecting. This gives more credence to legendary cyclist Eddy Merckx who says, “Don’t buy upgrades, ride up grades.”

Question 2: Does drinking a beer the night before a ride influence my riding performance?
Another surprising result: I tended to ride up the mountain faster if I had a beer the night before. Who knew that alcohol could be used as a performance-enhancing drug?

Question 3: Should I eat before a ride to increase performance?
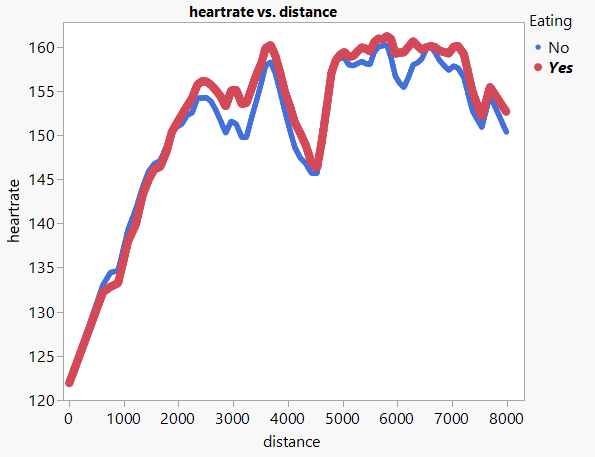
Eating before the ride did not impact my ride time up the mountain significantly, but it did have an impact on my two functional responses: heart rate and speed. Below is a graph of my average heart rate by distance into the climb based on whether I eat before the ride or not. With eating, my heart rate tends to be higher and stay higher longer.

This graph shows my speed profile during the ride. As you can see, eating has an impact on the profile even though it does not have an impact on the overall time.

Conclusion
I had a lot of unexpected results, finding that a heavier bike and having a beer the night before actually improved cycling performance. While snacks did not impact my time, they did lead to an overall higher heart rate and a different speed profile. All in all, I think the experiment was a success. Now I can let my wife know that I need a beer tonight because I plan to go for a bike ride tomorrow. Cheers!