- JMP Statement Regarding Critical PHP Remote Code Execution Vulnerabilities (CVE-2026-109618, CVE-2026-109619)
- Don’t miss your chance to experience Discovery Summit Europe at our best available rate! Early bird registration through 31 Oct.
- Graph Builder Toolbar streamlines interactive graphing. Creates shortcuts on Report and GraphBuilder Helpers toolbars. Download and install the extension.
- Subscribe to RSS Feed
- Mark Topic as New
- Mark Topic as Read
- Float this Topic for Current User
- Bookmark
- Subscribe
- Mute
- Printer Friendly Page
Discussions
Solve problems, and share tips and tricks with other JMP users.- User Community
- :
- Discussions
- :
- which G rand R value should I look at?

- Mark as New
- Bookmark
- Subscribe
- Mute
- Subscribe to RSS Feed
- Get Direct Link
- Report Inappropriate Content
which G rand R value should I look at?
hi
I have a question regarding Gage R&R in jump.
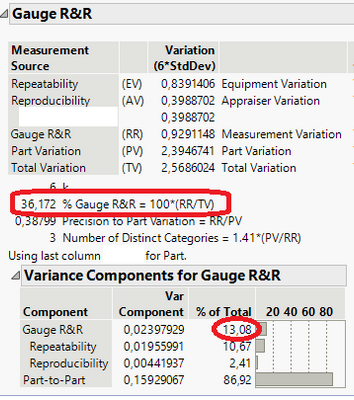
I have done a study and I am getting 2 Gage R&R values. I am not sure which one is the one.
I think the 38 % ?
am I correct or the 14% is the right value for the study?
Accepted Solutions

- Mark as New
- Bookmark
- Subscribe
- Mute
- Subscribe to RSS Feed
- Get Direct Link
- Report Inappropriate Content
Re: which G rand R value should I look at?
Hi Falcon,
Welcome to our community!
The way I read the chart is that:
The 36,172 is a number showing how much of the total variation is comming from your GRR study. In other words 36,172 of your variation is due to your measurement equipment and procedure.
The 13,08 % is how much of the much of the uncertainty in your GRR you can affect by improving your measurement setup.
The intresting number here is what is found under Guage RR (RR) which is 0,9291148. That number is how much uncertainty you need to include in your uncertainity budget. Keep in mind that that number is 6*stddev (where k=6).
If you compare that number to your specification/tolerance window you would see how much of your tolerance window is used by your measurement uncertainty. This number is also called Precision to Tolerance Ratio or PT Ratio.
Hope that helps
Best Christian
- Mark as New
- Bookmark
- Subscribe
- Mute
- Subscribe to RSS Feed
- Get Direct Link
- Report Inappropriate Content
Re: which G rand R value should I look at?
Hi Falcon,
Welcome to our community!
The way I read the chart is that:
The 36,172 is a number showing how much of the total variation is comming from your GRR study. In other words 36,172 of your variation is due to your measurement equipment and procedure.
The 13,08 % is how much of the much of the uncertainty in your GRR you can affect by improving your measurement setup.
The intresting number here is what is found under Guage RR (RR) which is 0,9291148. That number is how much uncertainty you need to include in your uncertainity budget. Keep in mind that that number is 6*stddev (where k=6).
If you compare that number to your specification/tolerance window you would see how much of your tolerance window is used by your measurement uncertainty. This number is also called Precision to Tolerance Ratio or PT Ratio.
Hope that helps
Best Christian
Recommended Articles
- © 2026 JMP Statistical Discovery LLC. All Rights Reserved.
- Terms of Use
- Privacy Statement
- Contact Us