- Don’t miss your chance to experience Discovery Summit Europe at our best available rate! Early bird registration through 31 Oct.
- Image to Table JMP extension imports single or batch images as data tables. Useful to extract curves from pictures or convert image data to curve data to use in analyses like Functional Data Explorer. Download and install the extension.
- Subscribe to RSS Feed
- Mark Topic as New
- Mark Topic as Read
- Float this Topic for Current User
- Bookmark
- Subscribe
- Mute
- Printer Friendly Page
Discussions
Solve problems, and share tips and tricks with other JMP users.- User Community
- :
- Discussions
- :
- values > 1 in Oneway Analysis: Compare Densities: what are they?

- Mark as New
- Bookmark
- Subscribe
- Mute
- Subscribe to RSS Feed
- Get Direct Link
- Report Inappropriate Content
values > 1 in Oneway Analysis: Compare Densities: what are they?
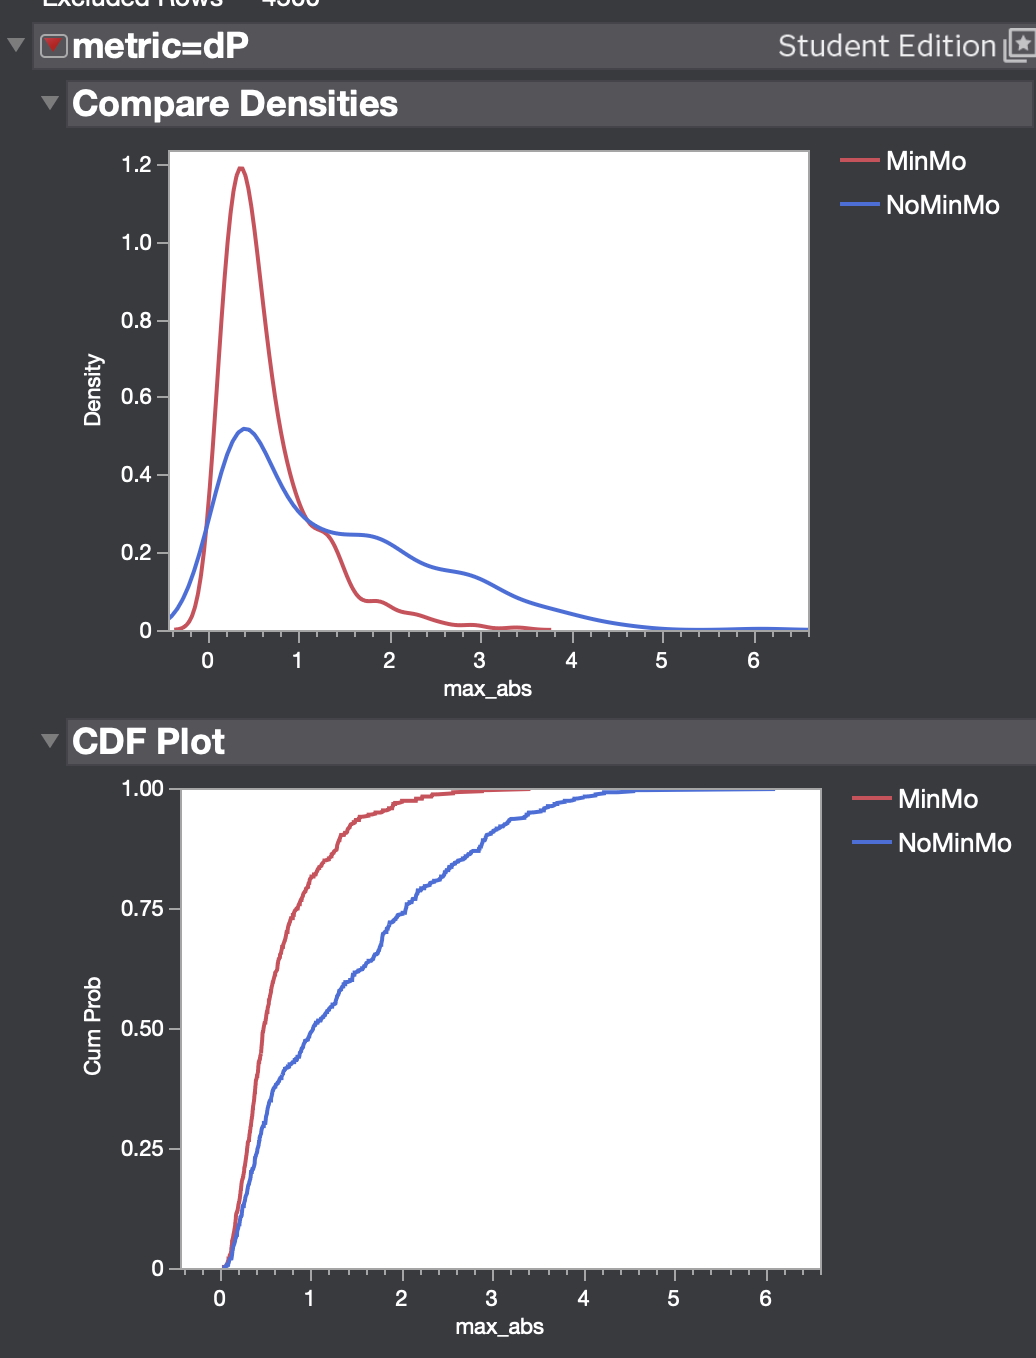
In the simple Oneway analysis platform, there is an option to compare what I understood to be probability densities from x conditions, along with the CDF. However, the y-axis scale is ... confusing, in that it goes above 1 (as shown in fig). And in fact can go up past 2.5.
Anyone know what this number actually represents? I couldn't find it anywhere in the documentation.
Thanks in advance!


- Mark as New
- Bookmark
- Subscribe
- Mute
- Subscribe to RSS Feed
- Get Direct Link
- Report Inappropriate Content
Re: values > 1 in Oneway Analysis: Compare Densities: what are they?
Compare Densities
Shows or hides a plot of overlaid probability density functions for each group.
https://www.jmp.com/en/statistics-knowledge-portal/inferential-statistics/probability-distributions , The range of the PDF is non-negative and the integral over all values of the random variable is one.
- Mark as New
- Bookmark
- Subscribe
- Mute
- Subscribe to RSS Feed
- Get Direct Link
- Report Inappropriate Content
Re: values > 1 in Oneway Analysis: Compare Densities: what are they?
thanks - yours truly was confusing probability density and probability mass....
Recommended Articles
- © 2026 JMP Statistical Discovery LLC. All Rights Reserved.
- Terms of Use
- Privacy Statement
- Contact Us