- Discovery Summit 2026: Early User Edition - September 23-24.Register. It's free.
- Graph Builder Toolbar streamlines interactive graphing. Creates shortcuts on Report and GraphBuilder Helpers toolbars. Download and install the extension.
- Subscribe to RSS Feed
- Mark Topic as New
- Mark Topic as Read
- Float this Topic for Current User
- Bookmark
- Subscribe
- Mute
- Printer Friendly Page
Discussions
Solve problems, and share tips and tricks with other JMP users.- User Community
- :
- Discussions
- :
- values > 1 in Oneway Analysis: Compare Densities: what are they?

- Mark as New
- Bookmark
- Subscribe
- Mute
- Subscribe to RSS Feed
- Get Direct Link
- Report Inappropriate Content
values > 1 in Oneway Analysis: Compare Densities: what are they?
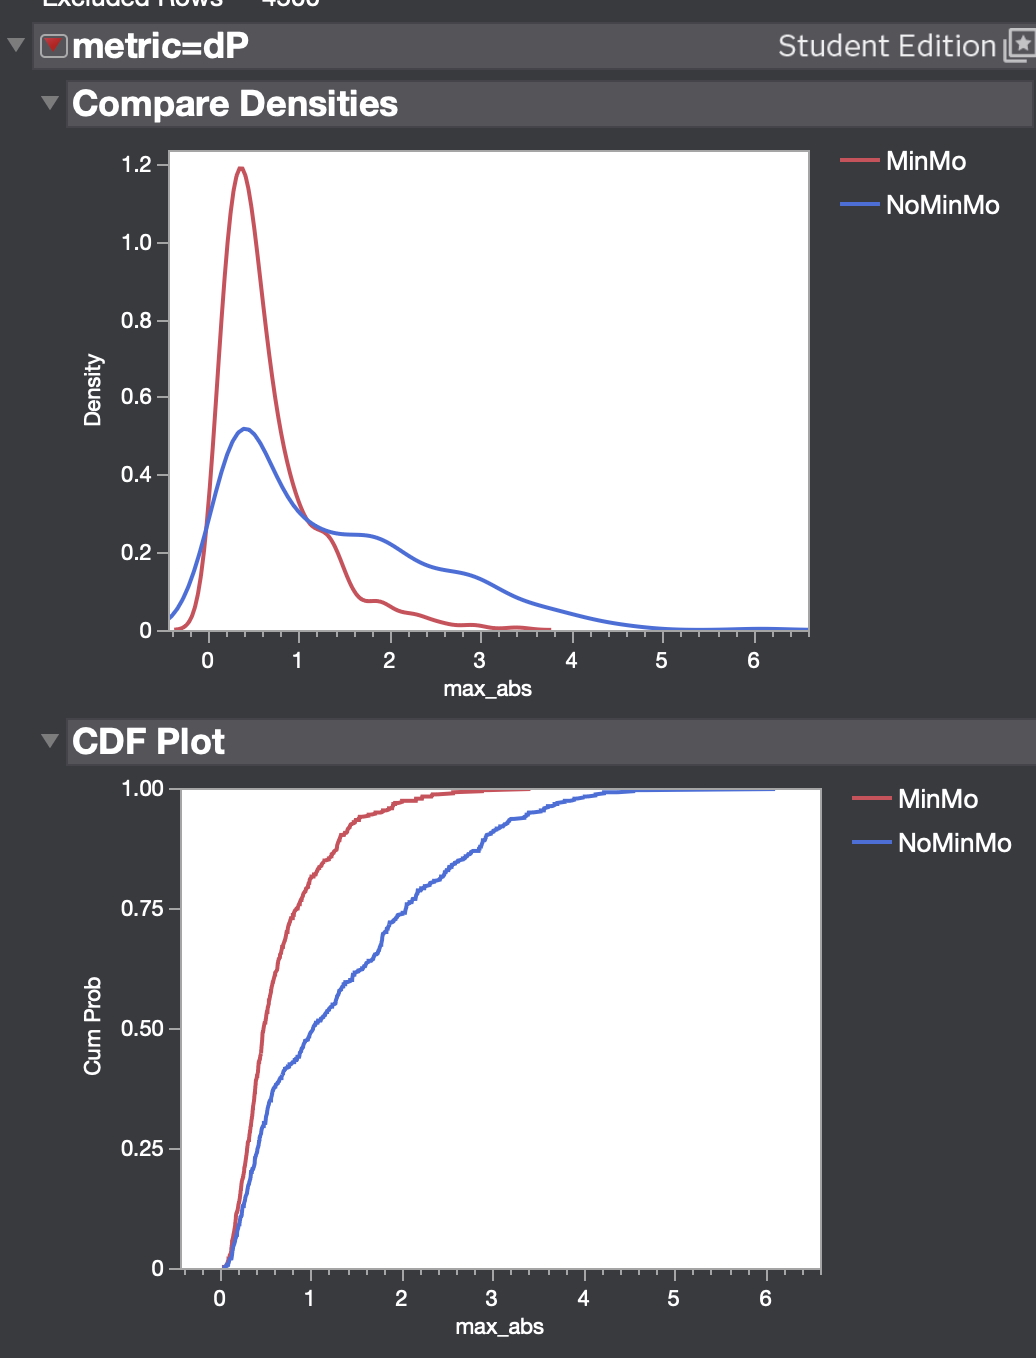
In the simple Oneway analysis platform, there is an option to compare what I understood to be probability densities from x conditions, along with the CDF. However, the y-axis scale is ... confusing, in that it goes above 1 (as shown in fig). And in fact can go up past 2.5.
Anyone know what this number actually represents? I couldn't find it anywhere in the documentation.
Thanks in advance!


- Mark as New
- Bookmark
- Subscribe
- Mute
- Subscribe to RSS Feed
- Get Direct Link
- Report Inappropriate Content
Re: values > 1 in Oneway Analysis: Compare Densities: what are they?
Compare Densities
Shows or hides a plot of overlaid probability density functions for each group.
https://www.jmp.com/en/statistics-knowledge-portal/inferential-statistics/probability-distributions , The range of the PDF is non-negative and the integral over all values of the random variable is one.
- Mark as New
- Bookmark
- Subscribe
- Mute
- Subscribe to RSS Feed
- Get Direct Link
- Report Inappropriate Content
Re: values > 1 in Oneway Analysis: Compare Densities: what are they?
thanks - yours truly was confusing probability density and probability mass....
Recommended Articles
- © 2026 JMP Statistical Discovery LLC. All Rights Reserved.
- Terms of Use
- Privacy Statement
- Contact Us