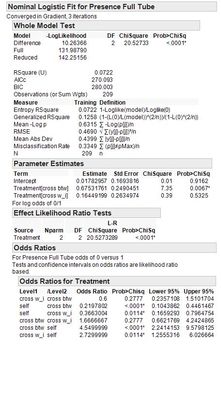
I've been using logistic regression with multiple categorical predictors. I'm particularly interested in the odds ratios, and I understand how the odds ratios themselves are calculated, but I'm having trouble understanding how the test statistics associated with each odds ratio are calculated. JMP gives the disclaimer "Tests and confidence intervals on odds ratios are likelihood ratio based." My question is, where does the p value associated with each odds ratio come from? Are they derived from a likelihood ratio? As I understand it, the whole model test, goodness of fit test, and effects tests all use the likelihood ratio to compute a chi square test statistic, but I cannot figure out how the p value (and the confidence intervals) for a given odds ratio are calculated. I've searched extensively online for an answer to this question with no success. It seems that if the explanatory variables are continuous, there is no p value associated with the odds ratio. In my case, the explanatory variable is categorical, with 3 levels, and there are odds ratios for each pairwise comparison. Any help with this would be much appreciated!