- Learn how to build custom Python data connectors and further customize JMP’s Data Connector Framework with the Python Data Connector Demo, available now in the JMP Marketplace!
- See how to create experiments to support product design and ID useful product features. Register for June 12 webinar, 2pm US Eastern Time.
- Subscribe to RSS Feed
- Mark Topic as New
- Mark Topic as Read
- Float this Topic for Current User
- Bookmark
- Subscribe
- Mute
- Printer Friendly Page
Discussions
Solve problems, and share tips and tricks with other JMP users.- JMP User Community
- :
- Discussions
- :
- reporting R-square for customised nonlinear model fit

- Mark as New
- Bookmark
- Subscribe
- Mute
- Subscribe to RSS Feed
- Get Direct Link
- Report Inappropriate Content
reporting R-square for customised nonlinear model fit
I am trying to find the best way to report a nonlinear model fit to my experimental data.
I have managed to write a script that fits a nonlinear model and finds the parameters estimates using the loss function. It then reports each parameter estimates and the non linear errors.
However, I would like to get the RMSE or R-square of the resulting fit also. Is this not available for nonlinear models? or do I need to add an extra analysis step?
When running the nonlinear analysis platform interactively the resulting plot shows both the experimental data and the model curve. However, when running the script automatically only the experimental data is shown. Does anyone know why this happens? Am I missing anything on the script below?
Could someone provide some literature/books/links to be able to get the graphs of the data vs resulting model fit and report the R-square of the fit?
The script I am using for the nonlinear model fit is the one below at the moment:
col1 = New Column( "Model" );
col1 << set formula(
	Parameter(
		{Y1_Y1_0 = 0.2, K1_K1_0 = 0.01, P1_P1_0 = 0.004, Y2_Y2_0 = 0.15, K2_K2_0 = 0.06, P2_P2_0 = 0.3},
		If( :Days > 0,
			Y1_Y1_0 * Exp( -Exp( ((K1_K1_0 * Exp()) / Y1_Y1_0) * (P1_P1_0 - :Days) ) ) + Y2_Y2_0 *
			Exp( -Exp( ((K2_K2_0 * Exp()) / Y2_Y2_0) * (P2_P2_0 - :Days) ) ),
			0
		)
	)
);
col2 = New Column( "Err" );
col2 << set Formula( Sum( (:Average - :Model) ^ 2 ) );
col2 << Evalformula;
col2 << Get formula;
obj = Nonlinear( Y( :Methane Yield ), X( :Model ), Loss( :Err ), Iteration Limit( 600 ), By( :Sample ) );
obj << go;
//returns a list of vectors where each vector, contains the parameters estimates
obj << get estimates;
//also see Get SSE, Get Parameter Names, Get CI
//Alternately, make a table
_xx = obj << Xpath( "//OutlineBox[@helpKey='Nonlinear Solution']" );
//only 2 groups so only 2 are found; each contains two sub tables
fit_dt = (_xx[1] << Find( Table Box( 1 ) )) << Make Combined Data Table;
est_dt = (_xx[1] << Find( Table Box( 2 ) )) << Make Combined Data Table;
fit_dt << set Name( "NonLin Fit Errors" );
est_dt << set Name( "NonLin Fit Estimates" );

- Mark as New
- Bookmark
- Subscribe
- Mute
- Subscribe to RSS Feed
- Get Direct Link
- Report Inappropriate Content
Re: reporting R-square for customised nonlinear model fit
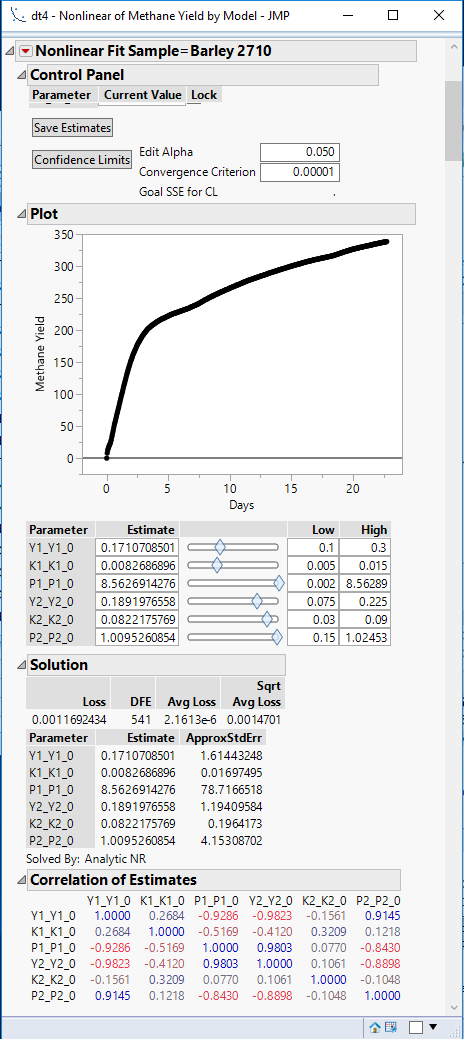
The RMSE is reported in the Solution outline:

The R square is not available because you need two models: the fitted model and the reduced model. There is no reduced model in the case of the non-linear model. (The reduced model in the OLS regression is the model with only the constant intercept term.)
You are incorrectly re-defining the default loss function in Nonlinear. The default loss is least squared error. It appears from your script that you want to use least squared error. Your column formula should result in the loss for each observation, not for the entire sample. So your loss formula should only be the squared difference. (That is, do not compute the sum of the squared differences.) With this approach instead of the default loss, I get:

So the use of a custom loss changes the information in the Solution outline to the total Loss (SSE in this case), the Avg Loss (MSE in this case), and the Sqrt Avg Loss (RMSE in this case).
I saved the script from Nonlinear and ran it. The data plot still shows the curve representing the graph of the nonlinear function.
- Mark as New
- Bookmark
- Subscribe
- Mute
- Subscribe to RSS Feed
- Get Direct Link
- Report Inappropriate Content
Re: reporting R-square for customised nonlinear model fit
Thanks Mark.
I have changed the Loss function as you suggested. I have run the fitting but still can't see the model curve on the Plot.
On my Solution I get: Avg Loss and Sqrt Avg Loss. Does this mean my RSME is the avaerage loss then?
- Mark as New
- Bookmark
- Subscribe
- Mute
- Subscribe to RSS Feed
- Get Direct Link
- Report Inappropriate Content
Re: reporting R-square for customised nonlinear model fit
Your RMSE is the Sqrt Avg Loss.
I don't know the cause of the absent plot.
Recommended Articles
- © 2026 JMP Statistical Discovery LLC. All Rights Reserved.
- Terms of Use
- Privacy Statement
- Contact Us