cancel
Showing results for 
Show  only  | Search instead for 
Did you mean: 
  • JMP will suspend normal business operations for our Winter Holiday beginning on Wednesday, Dec. 24, 2025, at 5:00 p.m. ET (2:00 p.m. ET for JMP Accounts Receivable).
    Regular business hours will resume at 9:00 a.m. EST on Friday, Jan. 2, 2026.
  • We’re retiring the File Exchange at the end of this year. The JMP Marketplace is now your destination for add-ins and extensions.

Discussions

Solve problems, and share tips and tricks with other JMP users.
%3CLINGO-SUB%20id%3D%22lingo-sub-261833%22%20slang%3D%22en-US%22%20mode%3D%22NONE%22%3E%E5%B0%87%E7%B5%B1%E8%A8%88%E5%88%86%E6%9E%90%E7%9A%84p%E5%80%BC%E6%89%93%E5%8D%B0%E5%88%B0%E5%88%97%3C%2FLINGO-SUB%3E%3CLINGO-BODY%20id%3D%22lingo-body-261833%22%20slang%3D%22en-US%22%20mode%3D%22NONE%22%3E%3CP%3E%E8%A6%AA%E6%84%9B%E7%9A%84%E7%A4%BE%E5%8D%80%EF%BC%8C%3C%2FP%3E%3CP%3E%E6%88%91%E7%9A%84%E6%95%B8%E6%93%9A%E8%A1%A8%E6%9C%89%E7%B4%845000%E8%A1%8C%EF%BC%8C%E5%85%B6%E4%B8%AD%E5%8C%85%E5%90%AB%E4%B8%89%E5%88%97%EF%BC%9AOTU%20ID%EF%BC%8C%E6%A2%9D%E4%BB%B6%EF%BC%8C%E7%9B%B8%E5%B0%8D%E8%B1%90%E5%BA%A6%3C%2FP%3E%3CP%3E%E6%88%91%E5%9F%B7%E8%A1%8C%E4%BA%86%E4%BB%A5%E4%B8%8B%E6%96%B9%E5%BC%8F%E7%9A%84Y-X%E5%88%86%E6%9E%90%EF%BC%9A%E6%A2%9D%E4%BB%B6%EF%BC%88X%EF%BC%89%EF%BC%8C%E7%9B%B8%E5%B0%8D%E8%B1%90%E5%BA%A6%EF%BC%88Y%EF%BC%89%E5%92%8COTU%20ID%EF%BC%88%E6%8C%89%EF%BC%89%26nbsp%3B%3C%2FP%3E%3CP%3E%E5%9C%A8%E5%96%AE%E5%90%91%E5%88%86%E6%9E%90%E5%A0%B1%E5%91%8A%E4%B8%AD%EF%BC%8C%E6%88%91%E5%BF%85%E9%A0%88%E6%89%8B%E5%8B%95%E6%AA%A2%E6%9F%A5%E6%AF%8F%E5%80%8BOTU%20ID%E4%BB%A5%E4%BA%86%E8%A7%A3%E4%BE%8B%E5%A6%82ttest%E6%88%96ANOVA%E4%B8%AD%E6%A2%9D%E4%BB%B6%E7%9A%84%E9%A1%AF%E8%91%97%E6%80%A7%3C%2FP%3E%3CP%3E%E6%9C%89%E6%B2%92%E6%9C%89%E4%B8%80%E7%A8%AE%E6%96%B9%E6%B3%95%E5%8F%AF%E4%BB%A5%E4%BD%BFJMP%E5%9C%A8%E5%B7%A5%E4%BD%9C%E7%B0%BF%E4%B8%AD%E4%BD%BF%E7%94%A8%E6%89%80%E9%9C%80%E7%B5%B1%E8%A8%88%E6%B8%AC%E8%A9%A6%E7%9A%84p%E5%80%BC%E6%89%93%E5%8D%B0%E4%B8%80%E5%80%8B%E6%96%B0%E5%88%97%EF%BC%8C%E8%80%8C%E7%84%A1%E9%9C%80%E9%81%8D%E6%AD%B7%E6%95%B4%E5%80%8B%E5%A0%B1%E5%91%8A%EF%BC%88%E6%9C%89%E6%95%B8%E7%99%BE%E7%94%9A%E8%87%B3%E6%95%B8%E5%8D%83%E5%80%8B%E6%B8%AC%E8%A9%A6%E9%9C%80%E8%A6%81%E7%80%8F%E8%A6%BD%EF%BC%89%3C%2FP%3E%3CP%3E%E8%AC%9D%E8%AC%9D%26nbsp%3B%20%26nbsp%3B%20%26nbsp%3B%3C%2FP%3E%3C%2FLINGO-BODY%3E%3CLINGO-SUB%20id%3D%22lingo-sub-261854%22%20slang%3D%22en-US%22%20mode%3D%22NONE%22%3E%E5%9B%9E%E5%A4%8D%EF%BC%9A%E5%B0%87%E7%B5%B1%E8%A8%88%E5%88%86%E6%9E%90%E7%9A%84p%E5%80%BC%E6%89%93%E5%8D%B0%E5%88%B0%E5%88%97%3C%2FLINGO-SUB%3E%3CLINGO-BODY%20id%3D%22lingo-body-261854%22%20slang%3D%22en-US%22%20mode%3D%22NONE%22%3E%3CP%3E%E5%84%98%E7%AE%A1%EF%BC%88%E5%A6%82%E6%9E%9C%E8%A6%81%E4%BD%BF%E7%94%A8%E8%85%B3%E6%9C%AC%EF%BC%89%E8%A9%B3%E7%B4%B0%E4%BF%A1%E6%81%AF%E5%B0%87%E5%8F%96%E6%B1%BA%E6%96%BC%E8%A6%81%E4%BD%BF%E7%94%A8%E7%9A%84%E6%B8%AC%E8%A9%A6%EF%BC%88%E6%9B%B4%E5%85%B7%E9%AB%94%E5%9C%B0%E8%AA%AA%EF%BC%8C%E5%8F%96%E6%B1%BA%E6%96%BC%E5%B9%B3%E5%8F%B0%E7%94%9F%E6%88%90%E7%9A%84%E5%A0%B1%E5%91%8A%E7%9A%84%E7%B5%90%E6%A7%8B%EF%BC%89%EF%BC%8C%E4%BD%86%E6%98%AFJMP%E9%80%9A%E5%B8%B8%E4%BD%BF%E5%9F%B7%E8%A1%8C%E9%80%99%E7%A8%AE%E6%93%8D%E4%BD%9C%E9%9D%9E%E5%B8%B8%E5%AE%B9%E6%98%93%E3%80%82%E4%B8%8B%E9%9D%A2%E7%9A%84%E8%85%B3%E6%9C%AC%E6%98%AF%E4%B8%80%E5%80%8B%E7%B0%A1%E5%96%AE%E7%9A%84%E7%A4%BA%E4%BE%8B%EF%BC%9A%3C%2FP%3E%0A%3CP%3E%26nbsp%3B%3C%2FP%3E%0A%3CPRE%3E%3CCODE%20class%3D%22%20language-jsl%22%3ENamesDefaultToHere(1)%3B%0A%0A%2F%2F%20Sample%20Data%0Adt1%20%3D%20Open(%22%24SAMPLE_DATA%2FBig%20Class.jmp%22)%3B%0A%0A%2F%2F%20One%20way%20ANOVA%20with%20a%20'By'%20group%0Aow%20%3D%20dt1%20%26lt%3B%26lt%3B%20Oneway(%20Y(%20%3Aheight%20)%2C%20X(%20%3Aage%20)%2C%20Means(%201%20)%2C%20Mean%20Diamonds(%201%20)%2C%20By(%20%3Asex%20))%3B%0A%0A%2F%2F%20Find%20the%20table%20you%20want%20in%20the%20report%2C%20do%20a%20right-click%20and%20select%20'Make%20Combined%20Data%20Table'%0Adt2%20%3D%20Report(ow%5B1%5D)%5BTableBox(2)%5D%20%26lt%3B%26lt%3B%20makeCombinedDataTable%3B%0Adt2%20%26lt%3B%26lt%3B%20setName(%22Oneway%20ANOVA%20Results%22)%3B%3C%2FCODE%3E%3C%2FPRE%3E%0A%3CP%3E%E4%BD%86%E6%98%AF%EF%BC%8C%E5%83%85%E5%83%85%E5%9B%A0%E7%82%BA%E5%AE%B9%E6%98%93%E5%B0%B1%E4%B8%8D%E8%83%BD%E6%88%90%E7%82%BA%E8%89%AF%E5%A5%BD%E7%9A%84%E5%AF%A6%E8%B8%90%E3%80%82%E5%A6%82%E6%9E%9C%E6%82%A8%E8%A6%81%E9%80%B2%E8%A1%8C%E5%A4%A7%E9%87%8F%E7%B5%B1%E8%A8%88%E6%AA%A2%E9%A9%97%EF%BC%8C%E6%88%91%3CSTRONG%3E%E5%BC%B7%E7%83%88%E5%9C%B0%3C%2FSTRONG%3E%E5%BB%BA%E8%AD%B0%E6%82%A8%E9%96%B1%E8%AE%80%E6%9C%89%E9%97%9C%3CA%20href%3D%22https%3A%2F%2Fwww.jmp.com%2Fsupport%2Fhelp%2Fen%2F15.1%2F%23page%2Fjmp%2Foverview-of-the-response-screening-platform.shtml%22%20target%3D%22_self%22%20rel%3D%22noopener%20noreferrer%22%3E%E9%9F%BF%E6%87%89%E7%AF%A9%E9%81%B8%3C%2FA%3E%20%E3%80%82%26nbsp%3B%3C%2FP%3E%3C%2FLINGO-BODY%3E%3CLINGO-SUB%20id%3D%22lingo-sub-261869%22%20slang%3D%22en-US%22%20mode%3D%22NONE%22%3E%E5%9B%9E%E5%A4%8D%EF%BC%9A%E5%B0%87%E7%B5%B1%E8%A8%88%E5%88%86%E6%9E%90%E7%9A%84p%E5%80%BC%E6%89%93%E5%8D%B0%E5%88%B0%E5%88%97%3C%2FLINGO-SUB%3E%3CLINGO-BODY%20id%3D%22lingo-body-261869%22%20slang%3D%22en-US%22%20mode%3D%22NONE%22%3E%3CP%3E%E5%8A%A0%E5%88%B0%3CA%20href%3D%22https%3A%2F%2Fcommunity.jmp.com%2Ft5%2Fuser%2Fviewprofilepage%2Fuser-id%2F3605%22%20target%3D%22_blank%22%3E%20%40ian_jmp%20%3C%2FA%3E%20%EF%BC%8C%E5%8F%AA%E9%9C%80%E5%8F%B3%E9%8D%B5%E5%96%AE%E6%93%8A%E5%85%B7%E6%9C%89p%E5%80%BC%E7%9A%84%E8%A1%A8%E4%B9%8B%E4%B8%80%EF%BC%8C%E7%84%B6%E5%BE%8C%E9%81%B8%E6%93%87%3CSTRONG%3E%E8%A3%BD%E6%88%90%E7%B5%84%E5%90%88%E8%A1%A8%3C%2FSTRONG%3E%20%E3%80%82%3C%2FP%3E%3C%2FLINGO-BODY%3E%3CLINGO-SUB%20id%3D%22lingo-sub-261889%22%20slang%3D%22en-US%22%20mode%3D%22NONE%22%3E%E5%9B%9E%E5%A4%8D%EF%BC%9A%E5%B0%87%E7%B5%B1%E8%A8%88%E5%88%86%E6%9E%90%E7%9A%84p%E5%80%BC%E6%89%93%E5%8D%B0%E5%88%B0%E5%88%97%3C%2FLINGO-SUB%3E%3CLINGO-BODY%20id%3D%22lingo-body-261889%22%20slang%3D%22en-US%22%20mode%3D%22NONE%22%3E%3CP%3E%E5%97%A8%EF%BC%8C%E9%A6%AC%E5%85%8B%EF%BC%8C%3C%2FP%3E%3CP%3E%E9%80%99%E5%B0%8D%E6%88%91%E4%B8%8D%E8%B5%B7%E4%BD%9C%E7%94%A8%EF%BC%8C%E5%AE%83%E5%8F%AA%E7%94%A8%E4%BA%86%E5%B9%BE%E7%99%BE%E5%80%8B%E8%A1%A8%E6%A0%BC%E4%B8%AD%E7%9A%84%E4%BA%94%E5%80%8B%E8%A3%BD%E4%BD%9C%E4%BA%86%E4%B8%80%E5%80%8B%E6%95%B8%E6%93%9A%E8%A1%A8%EF%BC%8C%E8%80%8C%E4%B8%94p%E5%80%BC%E7%9A%84%E7%B5%84%E7%B9%94%E4%B8%8D%E7%95%B6%3C%2FP%3E%3C%2FLINGO-BODY%3E%3CLINGO-SUB%20id%3D%22lingo-sub-261891%22%20slang%3D%22en-US%22%20mode%3D%22NONE%22%3E%E5%9B%9E%E5%A4%8D%EF%BC%9A%E5%B0%87%E7%B5%B1%E8%A8%88%E5%88%86%E6%9E%90%E7%9A%84p%E5%80%BC%E6%89%93%E5%8D%B0%E5%88%B0%E5%88%97%3C%2FLINGO-SUB%3E%3CLINGO-BODY%20id%3D%22lingo-body-261891%22%20slang%3D%22en-US%22%20mode%3D%22NONE%22%3E%3CP%3E%E8%AC%9D%E8%AC%9D%EF%BC%8C%E6%88%91%E5%9F%BA%E6%9C%AC%E4%B8%8A%E4%BD%BF%E7%94%A8%E2%80%9C%20By%E2%80%9D%E5%88%97%E4%BD%9C%E7%82%BA%E5%88%86%E7%B5%84%E8%AE%8A%E9%87%8F%E4%BE%86%E9%80%B2%E8%A1%8C%E9%9F%BF%E6%87%89%E7%AF%A9%E9%81%B8%EF%BC%8C%E4%B8%A6%E4%B8%94%E5%AE%83%E7%82%BA%E6%AF%8F%E5%80%8B%E5%88%86%E7%B5%84%E8%AE%8A%E9%87%8F%E6%89%93%E5%8D%B0%E4%BA%86%E4%B8%80%E5%80%8B%E5%B8%B6%E6%9C%89P%E5%80%BC%E7%9A%84%E8%A1%A8%E6%A0%BC%EF%BC%8C%E6%88%91%E8%83%BD%E5%A4%A0%E9%81%8E%E6%BF%BE%E5%87%BA%26lt%3B0.05%3C%2FP%3E%3CP%3E%E9%80%99%E6%A5%B5%E5%A4%A7%E5%9C%B0%E5%B9%AB%E5%8A%A9%E4%BA%86%EF%BC%81%3C%2FP%3E%3CP%3E%E7%84%B6%E8%80%8C...%20%E6%AD%A3%E5%9C%A8%E9%81%8B%E8%A1%8C%E7%9A%84%E9%BB%98%E8%AA%8D%E7%B5%B1%E8%A8%88%E6%B8%AC%E8%A9%A6%E6%98%AF%E4%BB%80%E9%BA%BC%EF%BC%8C%E5%8D%B3%EF%BC%8C%E5%A6%82%E6%9E%9C%E6%88%91%E4%B8%8D%E9%81%B8%E6%93%87%E4%BB%BB%E4%BD%95%E9%81%B8%E9%A0%85%E8%80%8C%E5%83%85%E9%81%8B%E8%A1%8C%E5%B0%8D%E8%A9%B1%E6%A1%86%EF%BC%8C%E5%89%87p%E5%80%BC%E5%B0%8D%E6%87%89%E4%BB%80%E9%BA%BC%EF%BC%9F%3C%2FP%3E%3C%2FLINGO-BODY%3E
Choose Language Hide Translation Bar
ezorlo
Level IV

print p-values of statistical analysis to a column

Dear Community,

My data table has ~5000 rows with three columns: OTU ID, condition, Relative abundance

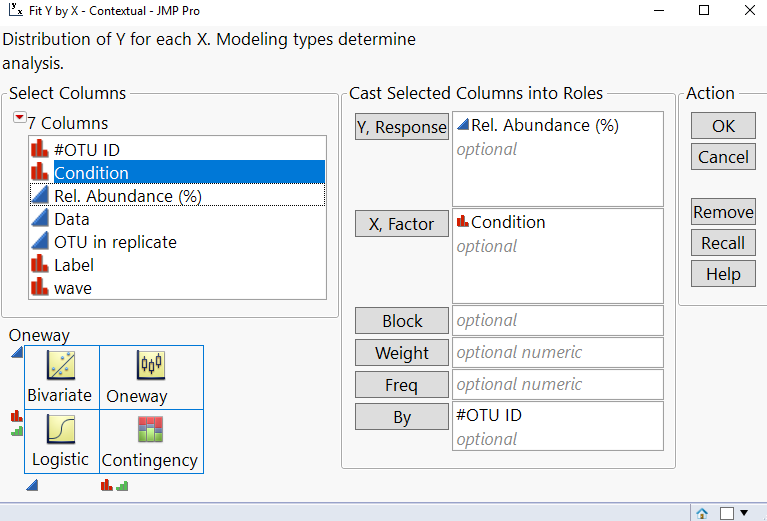
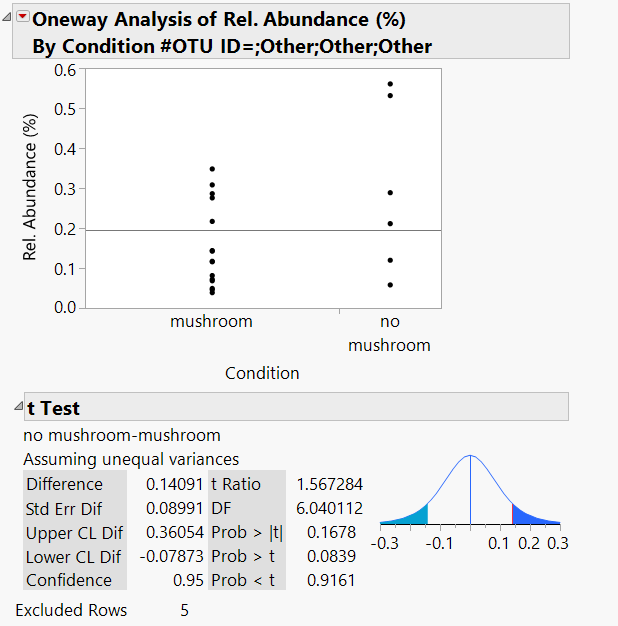
I performed a one way Y - X analysis with the designations: condition (X), Relative Abundance (Y) and OTU ID (By) 

In the one-way analysis report I have to manually check each of the OTU ID for significance effect of condition in e.g. ttest or ANOVA

Is there a way to make JMP print a new column in my workbook with the p-value for the desired statistical test without going through the entire report (there are hundreds or even thousands of tests to look through)

Thank you     

1 ACCEPTED SOLUTION

Accepted Solutions
ian_jmp
Level X

Re: print p-values of statistical analysis to a column

JMP generally makes it very easy to do this kind of thing, though (if you want to use a script) the details will depend on which test you want to use (more specifically, on the structure of the report that the platform generates). The script below is a simple example:


NamesDefaultToHere(1);

// Sample Data
dt1 = Open("$SAMPLE_DATA/Big Class.jmp");

// One way ANOVA with a 'By' group
ow = dt1 << Oneway(	Y( :height ), X( :age ), Means( 1 ), Mean Diamonds( 1 ), By( :sex ));

// Find the table you want in the report, do a right-click and select 'Make Combined Data Table'
dt2 = Report(ow[1])[TableBox(2)] << makeCombinedDataTable;
dt2 << setName("Oneway ANOVA Results");

But just because something is easy does not make it good practice. If you are doing lots of statistical tests, I strongly recommend that you read about Response Screening

View solution in original post

4 REPLIES 4
ian_jmp
Level X

Re: print p-values of statistical analysis to a column

JMP generally makes it very easy to do this kind of thing, though (if you want to use a script) the details will depend on which test you want to use (more specifically, on the structure of the report that the platform generates). The script below is a simple example:


NamesDefaultToHere(1);

// Sample Data
dt1 = Open("$SAMPLE_DATA/Big Class.jmp");

// One way ANOVA with a 'By' group
ow = dt1 << Oneway(	Y( :height ), X( :age ), Means( 1 ), Mean Diamonds( 1 ), By( :sex ));

// Find the table you want in the report, do a right-click and select 'Make Combined Data Table'
dt2 = Report(ow[1])[TableBox(2)] << makeCombinedDataTable;
dt2 << setName("Oneway ANOVA Results");

But just because something is easy does not make it good practice. If you are doing lots of statistical tests, I strongly recommend that you read about Response Screening

ezorlo
Level IV

Re: print p-values of statistical analysis to a column

Thank you I basically went with response screening using my "By" column as a grouping variable and it printed a table with P-values for each grouping variable that I was able to filter for <0.05

This immensely helped!!

However... what is the default statistical test that is being run, i.e. what does the p-value correspond to if I dont select any options and just run the dialog?

Re: print p-values of statistical analysis to a column

Adding to @ian_jmp , just right-click on one of the tables with p-values and select Make Into Combined Table.

ezorlo
Level IV

Re: print p-values of statistical analysis to a column

Hi Mark,

This did not work for me, it made a data table with only five of the several hundred tables, also the p-values were not organized properly

Recommended Articles