- JMP Statement Regarding Critical PHP Remote Code Execution Vulnerabilities (CVE-2026-109618, CVE-2026-109619)
- Don’t miss your chance to experience Discovery Summit Europe at our best available rate! Early bird registration through 31 Oct.
- Graph Builder Toolbar streamlines interactive graphing. Creates shortcuts on Report and GraphBuilder Helpers toolbars. Download and install the extension.
- Subscribe to RSS Feed
- Mark Topic as New
- Mark Topic as Read
- Float this Topic for Current User
- Bookmark
- Subscribe
- Mute
- Printer Friendly Page
Discussions
Solve problems, and share tips and tricks with other JMP users.- User Community
- :
- Discussions
- :
- Re: pareto graph in JMP-please help
- Mark as New
- Bookmark
- Subscribe
- Mute
- Subscribe to RSS Feed
- Get Direct Link
- Report Inappropriate Content
pareto graph in JMP-please help
Hi ALl
Iam trying to draw a Pareto graph in JMP with the following columns in my excel. Can someone help me how to draw a pareto that has cost and cumulative percentage?
Data:-
PONC Summary Cost ($) Cum%
Operator Error 250000 65.8%
Packaging/Hanlding 34013 74.8%
Assembly Realted 25000 78.2%
Equipment function 32000 78.3%
Maintenance 18000 100%
please help me for that sample data
thanks,
Accepted Solutions


 Community Manager
- Mark as New
- Bookmark
- Subscribe
- Mute
- Subscribe to RSS Feed
- Get Direct Link
- Report Inappropriate Content
Re: pareto graph in JMP-please help
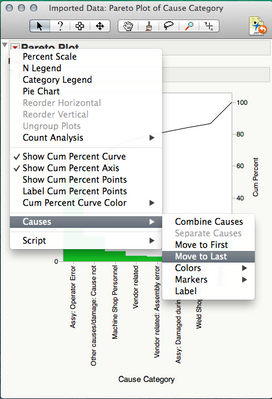
You can click on a bar in the Pareto plot and choose "Causes->Move to Last".
-Jeff
Community Manager
- Mark as New
- Bookmark
- Subscribe
- Mute
- Subscribe to RSS Feed
- Get Direct Link
- Report Inappropriate Content
Re: pareto graph in JMP-please help
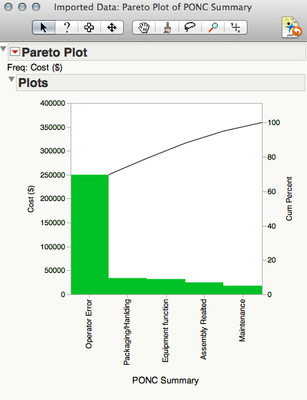
I the Pareto Plot dialog you can use PONC Summary in the Y, Cause role and the Cost column in the Freq role.
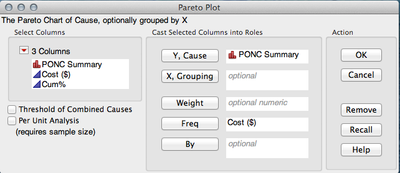
You'll get this pareto plot.
-Jeff
- Mark as New
- Bookmark
- Subscribe
- Mute
- Subscribe to RSS Feed
- Get Direct Link
- Report Inappropriate Content
Re: pareto graph in JMP-please help
Thanks a lot. In pareto graphs, how do we get the "OThers" column at the end of the graph? Thanks
Community Manager
- Mark as New
- Bookmark
- Subscribe
- Mute
- Subscribe to RSS Feed
- Get Direct Link
- Report Inappropriate Content
Re: pareto graph in JMP-please help
You can click on a bar in the Pareto plot and choose "Causes->Move to Last".
-Jeff
Recommended Articles
- © 2026 JMP Statistical Discovery LLC. All Rights Reserved.
- Terms of Use
- Privacy Statement
- Contact Us