- Instantly extract effect sizes, F-ratios, and FDR-adjusted p-values from your models with the Calculate Effects Sizes extension, available now in the JMP Marketplace!
- New to JMP? Join us Sept. 23-24 for the Early User Edition of Discovery Summit, tailor-made for new users. Register now for free!
- Your voice matters! Tell us how you prefer to receive JMP updates, so we can tailor our communication to your needs. Take short survey.
- Subscribe to RSS Feed
- Mark Topic as New
- Mark Topic as Read
- Float this Topic for Current User
- Bookmark
- Subscribe
- Mute
- Printer Friendly Page
Discussions
Solve problems, and share tips and tricks with other JMP users.- JMP User Community
- :
- Discussions
- :
- over lay plot

- Mark as New
- Bookmark
- Subscribe
- Mute
- Subscribe to RSS Feed
- Get Direct Link
- Report Inappropriate Content
over lay plot
I've graphed why data sets. I'm trying to overlay them using graph builder so I can manipulate / scale the axis but I'm only able to figure out how to stack (or over lay using Graph->Legacy->Overlay which doesn't let me manipulate the axis like I'd like). Any Ideas?
- Tags:
- macOS
Accepted Solutions

- Mark as New
- Bookmark
- Subscribe
- Mute
- Subscribe to RSS Feed
- Get Direct Link
- Report Inappropriate Content
Re: over lay plot
Ah......I didn't pick up on the fact that you wanted the graphs to be on top of each other. What you need to do for that, is to drag both Y variables to the Y drop area at the same time, or drag one and then the other to the center of the Y drop area. Then right click on the Y axis and select "Move Right" to move one of the axes to the right side of the graph. Then you will be able to adjust the 2 axes independently.

- Mark as New
- Bookmark
- Subscribe
- Mute
- Subscribe to RSS Feed
- Get Direct Link
- Report Inappropriate Content
Re: over lay plot
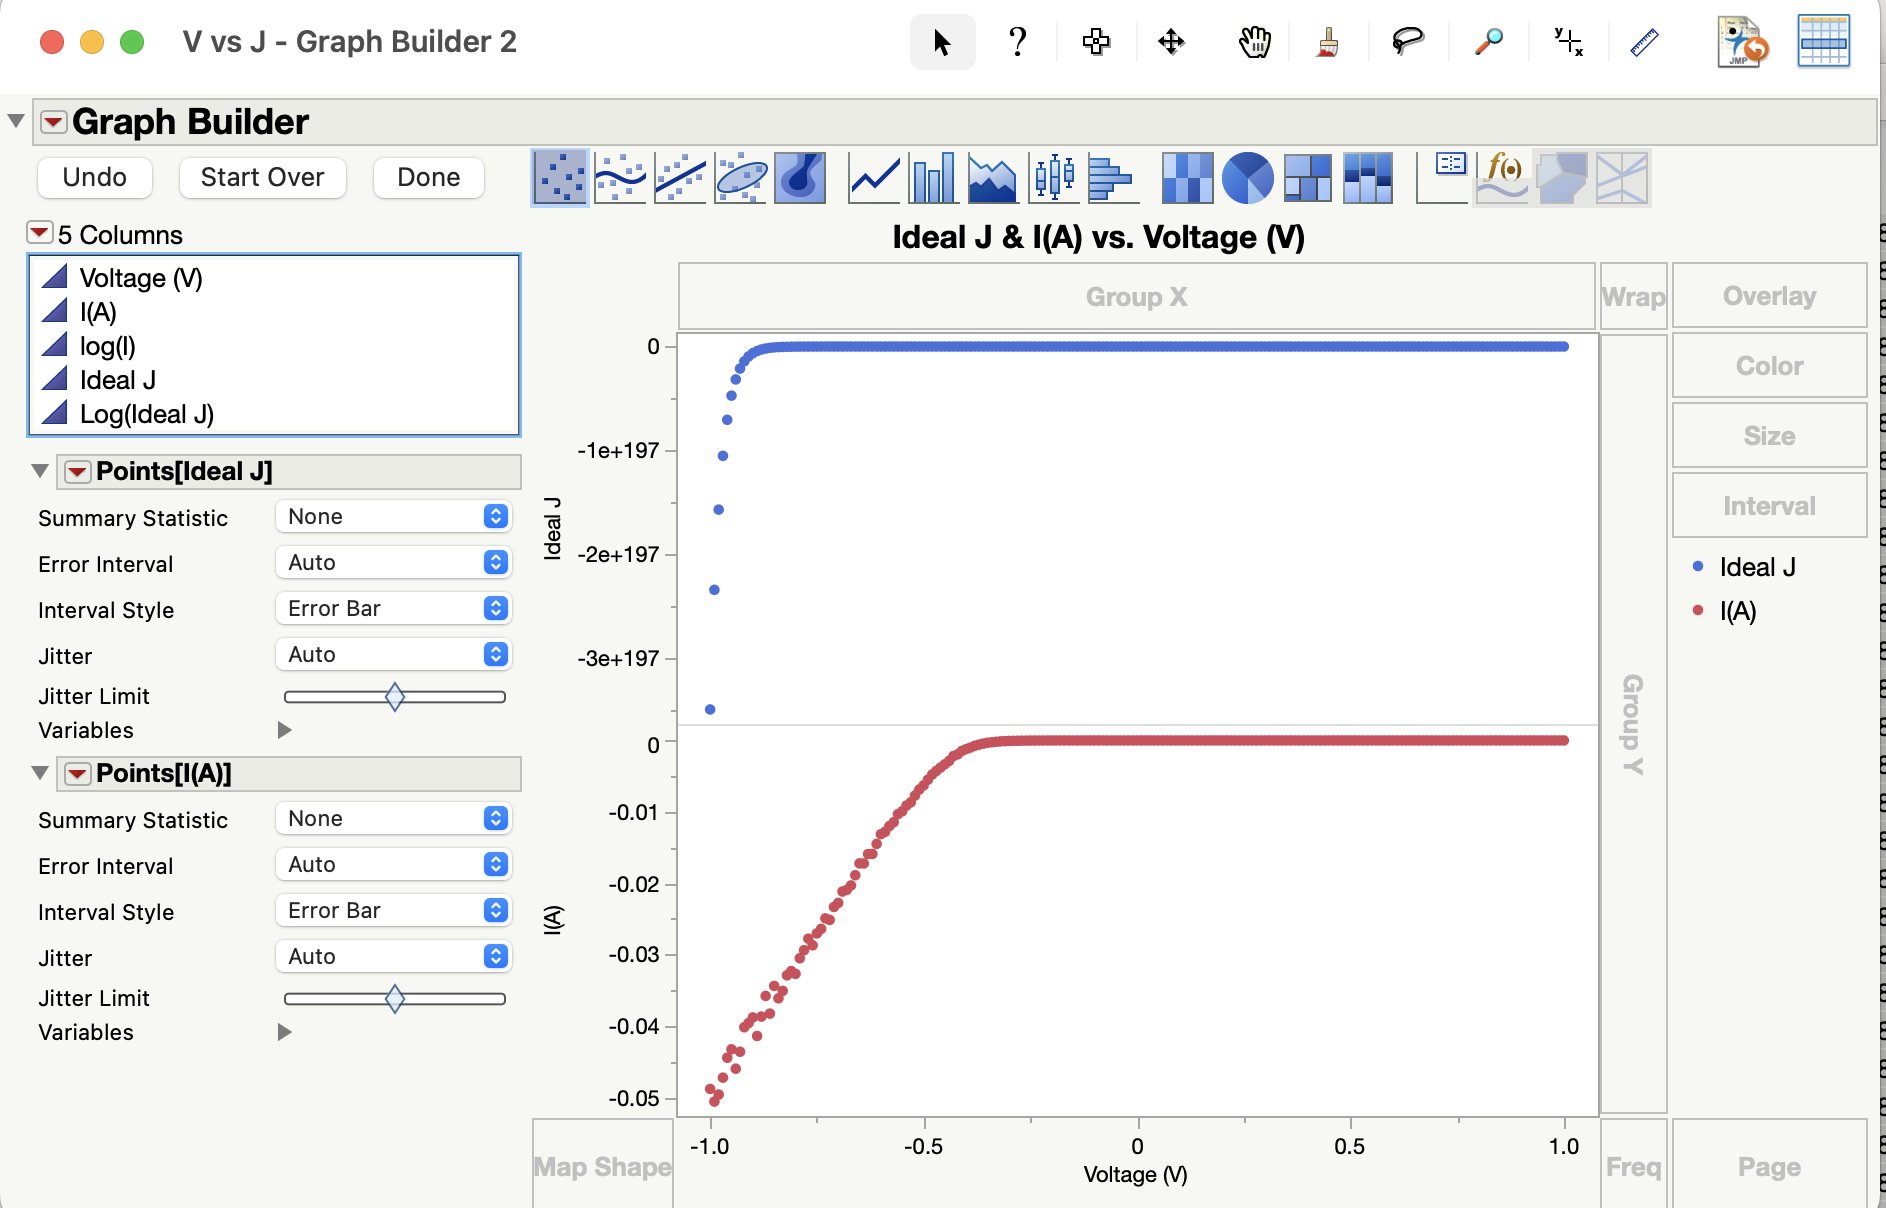
Go directly to Graph Builder.
Drag Voltage to the X axis
Drag Ideal J to the Y axis
Drag I to the bottom of the Y axis
To change the Ideal J axis, move to the Y axis for the axis for the values for the Ideal J on the graph, and right click. Select Axis Settings, and the values set will be changed only for the Ideal J values.
Repeat the same for the I values
The image you attached appears to be what you need to do. Just move to the Y axis area you want to change, right click, select Axis Settings, and make the changes.
- Mark as New
- Bookmark
- Subscribe
- Mute
- Subscribe to RSS Feed
- Get Direct Link
- Report Inappropriate Content
Re: over lay plot
hmm Im a bit confused. I was able to drag the axis's but that scaled. It didn't overlay the graphs on top of each other. Did I miss understand?
- Mark as New
- Bookmark
- Subscribe
- Mute
- Subscribe to RSS Feed
- Get Direct Link
- Report Inappropriate Content
Re: over lay plot
Ah......I didn't pick up on the fact that you wanted the graphs to be on top of each other. What you need to do for that, is to drag both Y variables to the Y drop area at the same time, or drag one and then the other to the center of the Y drop area. Then right click on the Y axis and select "Move Right" to move one of the axes to the right side of the graph. Then you will be able to adjust the 2 axes independently.
Recommended Articles
- © 2026 JMP Statistical Discovery LLC. All Rights Reserved.
- Terms of Use
- Privacy Statement
- Contact Us