- Don’t miss your chance to experience Discovery Summit Europe at our best available rate! Early bird registration through 31 Oct.
- Graph Builder Toolbar streamlines interactive graphing. Creates shortcuts on Report and GraphBuilder Helpers toolbars. Download and install the extension.
- Subscribe to RSS Feed
- Mark Topic as New
- Mark Topic as Read
- Float this Topic for Current User
- Bookmark
- Subscribe
- Mute
- Printer Friendly Page
Discussions
Solve problems, and share tips and tricks with other JMP users.- User Community
- :
- Discussions
- :
- Re: how to get fixed effect tests table to appear

- Mark as New
- Bookmark
- Subscribe
- Mute
- Subscribe to RSS Feed
- Get Direct Link
- Report Inappropriate Content
how to get fixed effect tests table to appear
I have a continuous response variable (Average) and a categorical predictor (Treatment) with labels 1 through 14 indicating the 14 levels. I have set the Treatment variable as ordinal, and was able to use the fit model function to obtain the least squares means table and least square means plot. However, I am unable to figure out how to obtain a table for a type 3 test of fixed effects. Specifically I am looking for a table with the column names:
Source Nparm DF DFDen F Ratio Prob > F
I believe it is called a Fixed Effect Tests table. If anybody knows how to obtain this, please let me know!


- Mark as New
- Bookmark
- Subscribe
- Mute
- Subscribe to RSS Feed
- Get Direct Link
- Report Inappropriate Content
Re: how to get fixed effect tests table to appear
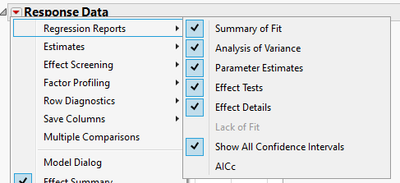


- Mark as New
- Bookmark
- Subscribe
- Mute
- Subscribe to RSS Feed
- Get Direct Link
- Report Inappropriate Content
Re: how to get fixed effect tests table to appear
Here is an example, :weight versus :age from Big Class sample data.
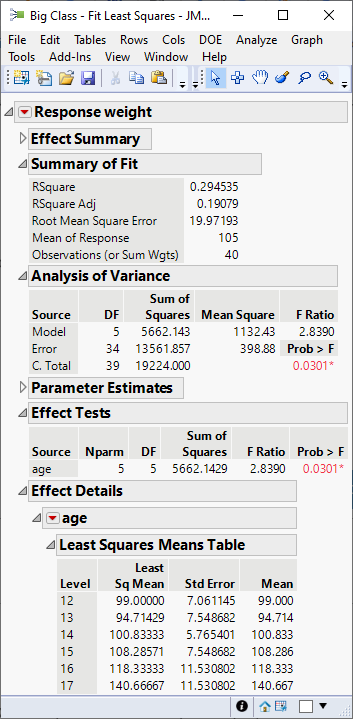

The Effect Tests table is the one you are looking for. It is based on Type III Sum of Squares.
Recommended Articles
- © 2026 JMP Statistical Discovery LLC. All Rights Reserved.
- Terms of Use
- Privacy Statement
- Contact Us