cancel
Showing results for 
Show  only  | Search instead for 
Did you mean: 
The Discovery Summit 2025 Call for Content is open! Submit an abstract today to present at our premier analytics conference.
See how to use to use Text Explorer to glean valuable information from text data at April 25 webinar.
Choose Language Hide Translation Bar
View Original Published Thread

how to custamize the rangeof the

Drharsha
Level II

in the attcehd file there are 3 graphs in one box, but on the y-axis all the three graphs have the same range i.e is 0-500. But if i want to customize the three graphs with differetn ranges  (like 0-200, 0-300, 0-500). So that all the graphs would fit in neatly. I tried changiin them but, all the values are changing at the same. or should i plot the three plots separatly. Plz share an answer, as i should submit this paper.


thank you very much 


with regards

Harsha

1 REPLY 1
txnelson
Super User


Re: how to custamize the rangeof the

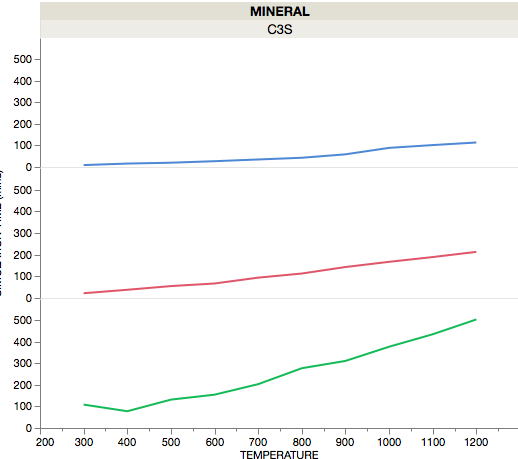
The picture that you inclosed is an incomplete graph.  You have cut off all of the axis values, which are what will give the clues as to how you have actually setup the graph.  

But, I will assume the issue is, that you have defined the 3 graphs by using a Y Grouping of a variable that has 3 different values.  Graphs setup with groupings maintain the axis values for all 3 graphs.  To setup a chart with separate setable axis values, you will need to set graphs us as separate variables on the graph.  For documentation on these options read the section on the Graph Builder in the Essential Graphics book

     Help==>Books==>Essential Grahicing

Jim