- New to JMP? Let the Data Analysis Director guide you through selecting an analysis task, an analysis goal, and a data type. Available now in the JMP Marketplace!
- See how to install JMP Marketplace extensions to customize and enhance JMP.
- Subscribe to RSS Feed
- Mark Topic as New
- Mark Topic as Read
- Float this Topic for Current User
- Bookmark
- Subscribe
- Mute
- Printer Friendly Page
Discussions
Solve problems, and share tips and tricks with other JMP users.- JMP User Community
- :
- Discussions
- :
- Re: how to create a graph with stratified x axis (like variability) but stacked ...

- Mark as New
- Bookmark
- Subscribe
- Mute
- Subscribe to RSS Feed
- Get Direct Link
- Report Inappropriate Content
how to create a graph with stratified x axis (like variability) but stacked colums?
HI
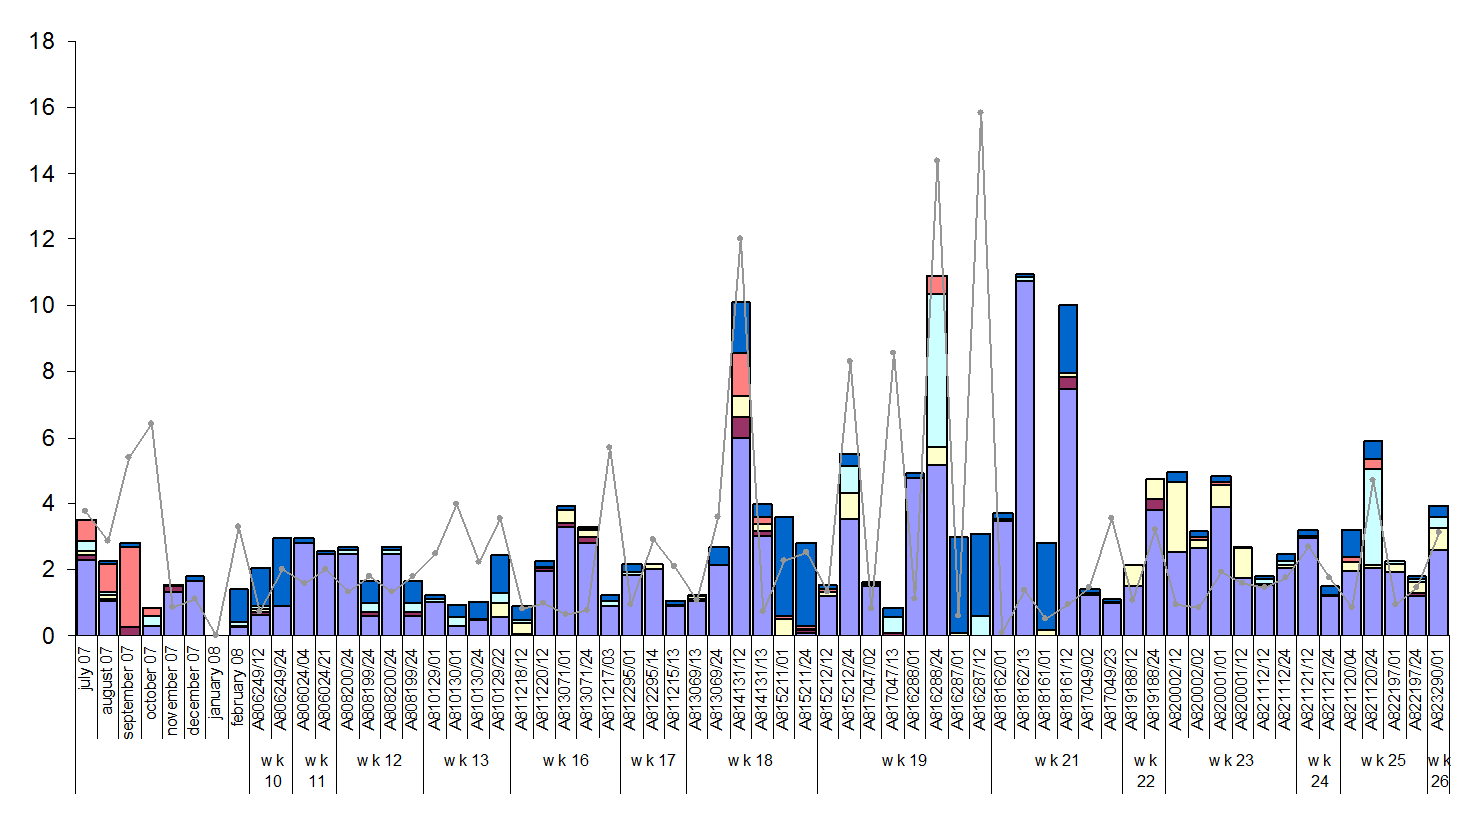
I would like to create a graph with this characteristics: multiple x axis value (let's say day-week-month-year) but displaying stacked bars. Is it possibile?
I wandered through index and manuals, but I found possibile this kind of axis for variability only, which accept Y data only as point and no multiple series of data.
on the other hand the chart is the only graph I found that displays stacked bars, but no way of maipulating the x axis ... there is a way to combine both?
maybe it is simple and I didn't look at the obvious, in this case please address me!
thanks
PS: I use variability not because it is a variability analysis, but because it does the graph i need. I think a proper graph is an essential analysis and a powerful communication tool
Accepted Solutions

- Mark as New
- Bookmark
- Subscribe
- Mute
- Subscribe to RSS Feed
- Get Direct Link
- Report Inappropriate Content
Re: how to create a graph with stratified x axis (like variability) but stacked colums?
You can do it Graph Builder in JMP 10. Drag multiple categorical variables into the X axis to nest them.
- Mark as New
- Bookmark
- Subscribe
- Mute
- Subscribe to RSS Feed
- Get Direct Link
- Report Inappropriate Content
Re: how to create a graph with stratified x axis (like variability) but stacked colums?
thank you Xan.
I have seen that graph builder is much better in JMP 10 and I'm glad to see that it could help with my issue, but unfortunately I am on JMP9 and will be for a couple of months at least. Do you know if there a workaround for that in JMP9, better if it's scriptable?
- Mark as New
- Bookmark
- Subscribe
- Mute
- Subscribe to RSS Feed
- Get Direct Link
- Report Inappropriate Content
Re: how to create a graph with stratified x axis (like variability) but stacked colums?
Only JMP 9 alternative I can think of is to create a new column for the X axis that represents the combined values and use Value Order property to control the order. That is, the combined column would have values like:
A1 B1
A1 B2
A2 B1
A2 B5
A3 B2
A3 B3
A3 B4
- Mark as New
- Bookmark
- Subscribe
- Mute
- Subscribe to RSS Feed
- Get Direct Link
- Report Inappropriate Content
Re: how to create a graph with stratified x axis (like variability) but stacked colums?
ok, thanks.
I already do value ordering for the primary X axis value (let's call it "day").
So the JMP9 workaround should be to create another column like "month"||"week"||"day" and to use that as axis?
I tried but it is a bit too graphically heavy, I think I'll wait for JMP10, thanks for your help.
thanks
damiano
- Mark as New
- Bookmark
- Subscribe
- Mute
- Subscribe to RSS Feed
- Get Direct Link
- Report Inappropriate Content
Re: how to create a graph with stratified x axis (like variability) but stacked colums?
ok, after other activities I turned back briefly on this issue (more for curiosity than for real necessity) aaand ... again no good.
the graph builder correctly accept my data and nest them if I use few lines (50? 100?), but if I toss in several hundred lines, it collapses the X axis leaving only the lowest categorical variable and in the label says "week & 2 more".
I don't want a median on week! I can do it with the standard chart graph!
I want to see on the X axis all the three variables, like on a variability ... is there a switch somewhere or a parameter in jsl to not collapse them?
thanks
damiano
Recommended Articles
- © 2026 JMP Statistical Discovery LLC. All Rights Reserved.
- Terms of Use
- Privacy Statement
- Contact Us