- Don’t miss your chance to experience Discovery Summit Europe at our best available rate! Early bird registration through 31 Oct.
- Graph Builder Toolbar streamlines interactive graphing. Creates shortcuts on Report and GraphBuilder Helpers toolbars. Download and install the extension.
- Subscribe to RSS Feed
- Mark Topic as New
- Mark Topic as Read
- Float this Topic for Current User
- Bookmark
- Subscribe
- Mute
- Printer Friendly Page
Discussions
Solve problems, and share tips and tricks with other JMP users.- User Community
- :
- Discussions
- :
- Why the lambda value of Spline fitting used in "Fit Y by X analysis" is differen...

- Mark as New
- Bookmark
- Subscribe
- Mute
- Subscribe to RSS Feed
- Get Direct Link
- Report Inappropriate Content
Why the lambda value of Spline fitting used in "Fit Y by X analysis" is different from the "Graph Builder"?
Hello, JMP developers,
I'm using JMP15.2.1 version.
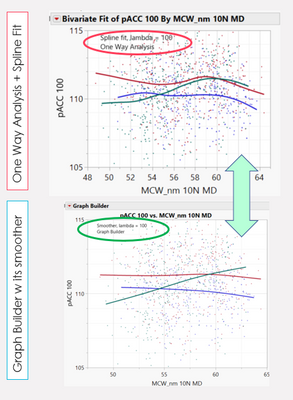
As below smooth fitting results(same datasets) in JMP when using the One Way Analysis (Fit Y by X) platform vs. Graph Builder, by setting the same lambda=100, the smoothness of the curve is totally different. (Fits are the same even if the lambda values differ by approximately 20x)
Is there a reason for such difference?


- Mark as New
- Bookmark
- Subscribe
- Mute
- Subscribe to RSS Feed
- Get Direct Link
- Report Inappropriate Content
Re: Why the lambda value of Spline fitting used in "Fit Y by X analysis" is different from the "Graph Builder"?
Hi @Jing,
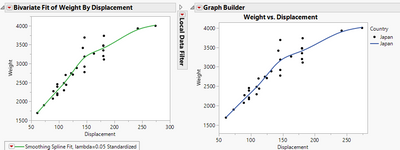
The graph builder uses standardized X variables. To get the same line in Bivariate, choose 'Other...' under the Red Triangle > Flexible > Fit Spline, use a lamda of 0.05 (default in graph builder) and check 'Standardize X'.
Names default to here(1);

dt = Open("$Sample_data/Car Physical Data.jmp");

New Window("Compare",
	H List Box(
		Bivariate(
			Y( :Weight ),
			X( :Displacement ),
			Fit Spline( 0.05, Standardized, {Line Color( {61, 174, 70} )} ),
			Where( :Country == "Japan" )
		),
		Graph Builder(
			Size( 400, 320 ),
			Show Control Panel( 0 ),
			Variables( X( :Displacement ), Y( :Weight ), Overlay( :Country ) ),
			Elements(
				Points( X, Y, Legend( 14 ) ),
				Smoother( X, Y, Legend( 15 ), Lambda( 0.05 ) )
			),
			Local Data Filter(
				Close Outline( 1 ),
				Add Filter( columns( :Country ), Where( :Country == "Japan" ) )
			)
		)
	)
);

- Mark as New
- Bookmark
- Subscribe
- Mute
- Subscribe to RSS Feed
- Get Direct Link
- Report Inappropriate Content
Re: Why the lambda value of Spline fitting used in "Fit Y by X analysis" is different from the "Graph Builder"?
What does Standardize X mean? How is it useful?

- Mark as New
- Bookmark
- Subscribe
- Mute
- Subscribe to RSS Feed
- Get Direct Link
- Report Inappropriate Content
Re: Why the lambda value of Spline fitting used in "Fit Y by X analysis" is different from the "Graph Builder"?
Standardized X means that you normalize your X distribution:
x = [[[ ARRAY OF X VALUES ]]]

x = (x - Mean( x )) / Std Dev( x );
After this, you'll create your cubic smoothing spline polynomials, then when creating your splines (which will be placed into this new scaled-x space), you simply unscale your spline's x-values.

- Mark as New
- Bookmark
- Subscribe
- Mute
- Subscribe to RSS Feed
- Get Direct Link
- Report Inappropriate Content
Re: Why the lambda value of Spline fitting used in "Fit Y by X analysis" is different from the "Graph Builder"?
I have a bit more data that I used and I get a very different spline fit using the graph builder and bivariate spline fit.
The graphs have the same scales, and there seems to be a horizontal shift in the splines.
The graph builder is on top while the bottom is from the bivariate fit.


TIA for any input
Recommended Articles
- © 2026 JMP Statistical Discovery LLC. All Rights Reserved.
- Terms of Use
- Privacy Statement
- Contact Us