- JMP will suspend normal business operations for our Winter Holiday beginning on Wednesday, Dec. 24, 2025, at 5:00 p.m. ET (2:00 p.m. ET for JMP Accounts Receivable).
Regular business hours will resume at 9:00 a.m. EST on Friday, Jan. 2, 2026. - We’re retiring the File Exchange at the end of this year. The JMP Marketplace is now your destination for add-ins and extensions.
- Subscribe to RSS Feed
- Mark Topic as New
- Mark Topic as Read
- Float this Topic for Current User
- Bookmark
- Subscribe
- Mute
- Printer Friendly Page
Discussions
Solve problems, and share tips and tricks with other JMP users.- JMP User Community
- :
- Discussions
- :
- Why is the power of my mixture design so low, even with an effect size of 20 sta...
- Mark as New
- Bookmark
- Subscribe
- Mute
- Subscribe to RSS Feed
- Get Direct Link
- Report Inappropriate Content
Why is the power of my mixture design so low, even with an effect size of 20 standard deviations?
Hi all,
I'd appreciate any advice. I'm helping a scientist at my company design a mixture experiment with 5 ingredients. We wish to measure main effects and 1st order interactions.
I asked the scientist to provide mins and maxes for the ingredient concentrations, the test precision standard deviation, and to estimate the effect size of the dominant ingredient. I'm relying on Power to decide how many runs are needed. The effect size of the dominant ingredient is about 20 standard deviations. I find for 30 runs, the power for this ingredient is only 0.168. For 60 runs, it's 0.33.
An effect size of 20 standard deviations is obviously very large, so I don't understand why the Power is so low for this case.
I investigated further by simulating results for 5 instances of the response variable with the appropriate coefficient and standard deviation, and the ingredient with the large effect size is statistically significant (p < 0.001) in all 5 cases.
What can I do? I'm not sure I trust the power calculation for this case. Am I hitting up against a limitation of the power calculation? How can I provide guidance on the number of runs required?
The scientist's goals for the design are perfectly reasonable, and I feel frustrated that I can't give him the guidance that he needs.
Many thanks! I attached a screenshot of the power, the .jmp design, and the text output of the models with the simulated responses, if you are inclined to take a look.
Accepted Solutions
- Mark as New
- Bookmark
- Subscribe
- Mute
- Subscribe to RSS Feed
- Get Direct Link
- Report Inappropriate Content
Re: Why is the power of my mixture design so low, even with an effect size of 20 standard deviations?
Here is the color map on the correlations that result from using the design with 30 runs.
This correlation inflates the variance of the estimates as shown in the Estimation Efficiency outline:
Your simulations uses a relative effect of 400 standard deviations, not 20. I used a coefficient of 10 to correspond to an effect of size 20. JMP Pro provides a built-in feature to simulate data very easily and quickly produce results for each re-sample, such as the Estimates column from the Parameter Estimates outline in Fit Least Squares. Here is the result for the estimate of Ingredient 5 from 2500 simulations.
I attached the table from the simulation so that you can explore it on your own.
Another aspect of mixture designs and modeling to keep in mind is that JMP tests against the null hypothesis that the parameter is 0. That test makes sense in the usual context of the linear model without constrains among the predictors. It is not simply a model with no intercept term. The intercept is part of the estimates for the linear effects. So the test for linear parameters should be against the null hypothesis that the parameter is the mean response.
- Mark as New
- Bookmark
- Subscribe
- Mute
- Subscribe to RSS Feed
- Get Direct Link
- Report Inappropriate Content
Re: Why is the power of my mixture design so low, even with an effect size of 20 standard deviations?
The constraint on the mixture components to sum to 1 introduces correlations among the parameter estimates. This correlation inflates the standard errors of the parameter estimates, which in turn reduces the power. If you...
- use a sum < 1,
- restrict the component range with a lower bound > 0 or an upper bound < 1,
- include linear constraints to the components,
- include higher-order terms in the model,
the correlation is higher and the effects are more pronounced.
Examine the Color Map on Correlations in the Design Evaluation outline.
- Mark as New
- Bookmark
- Subscribe
- Mute
- Subscribe to RSS Feed
- Get Direct Link
- Report Inappropriate Content
Re: Why is the power of my mixture design so low, even with an effect size of 20 standard deviations?
- Mark as New
- Bookmark
- Subscribe
- Mute
- Subscribe to RSS Feed
- Get Direct Link
- Report Inappropriate Content
Re: Why is the power of my mixture design so low, even with an effect size of 20 standard deviations?
Here is the color map on the correlations that result from using the design with 30 runs.
This correlation inflates the variance of the estimates as shown in the Estimation Efficiency outline:
Your simulations uses a relative effect of 400 standard deviations, not 20. I used a coefficient of 10 to correspond to an effect of size 20. JMP Pro provides a built-in feature to simulate data very easily and quickly produce results for each re-sample, such as the Estimates column from the Parameter Estimates outline in Fit Least Squares. Here is the result for the estimate of Ingredient 5 from 2500 simulations.
I attached the table from the simulation so that you can explore it on your own.
Another aspect of mixture designs and modeling to keep in mind is that JMP tests against the null hypothesis that the parameter is 0. That test makes sense in the usual context of the linear model without constrains among the predictors. It is not simply a model with no intercept term. The intercept is part of the estimates for the linear effects. So the test for linear parameters should be against the null hypothesis that the parameter is the mean response.
- Mark as New
- Bookmark
- Subscribe
- Mute
- Subscribe to RSS Feed
- Get Direct Link
- Report Inappropriate Content
Re: Why is the power of my mixture design so low, even with an effect size of 20 standard deviations?
I used a coefficient of "200" for Ingredient3 for both the power calculation and the simulations (and an RMSE of 1). Because Ingredient3 ranges from approximately 0 to approximately 0.1 in the design, I judged that this produces an effect size of approximately 20 standard deviations (200 * 0.1).
From my naive view, I set up the Power calculation and the simulations in a consistent way. When I fit the simulated data, the RMSE of of the models is about 1 and the range of the response is from about 0 - 20, so it still seems to jive. Is there an error in this thinking?
Getting back to the root issue...You're shown that there's a lot of correlation between the variables and this inflates the variance in the estimates. Does this mean that this mixture design with 5 ingredients, main effects, and first order interactions is impossible to estimate even with 60 runs?
I have a fall-back plan to use only a model with main effects to estimate the power, and once the data is collected, to consider any estimates of interactions a "bonus." What do you think about this? Is it too defeatist?
Many thanks. I greatly appreciate the insight.
- Mark as New
- Bookmark
- Subscribe
- Mute
- Subscribe to RSS Feed
- Get Direct Link
- Report Inappropriate Content
Re: Why is the power of my mixture design so low, even with an effect size of 20 standard deviations?
Generally, but not always, we perform mixture experiments to optimize a formulation of some kind as opposed to screen components. We are not interested in power that much. Instead, we are interested in the prediction performance of the model that is possible with a candidate design. Even so, this performance will not be as good as we are used to with unconstrained or independent factors.
There is nothing new in your case. You just were not aware of the issue or its origin before. We have successfully used such designs for decades in spite of the correlation to find the best blends.
I recommend "Strategies for Formulations Development: A Step-by-Step Guide Using JMP" by Ronald Snee and Roger Hoerl as a reference, in case you are in need of one. This recommendation is not an endorsement as there are other excellent textbooks about mixture experiments, but this one is rigorous and practical.
- Mark as New
- Bookmark
- Subscribe
- Mute
- Subscribe to RSS Feed
- Get Direct Link
- Report Inappropriate Content
Re: Why is the power of my mixture design so low, even with an effect size of 20 standard deviations?
A few more points to add to all of Mark's great advice. Low power in a formulation is typically caused by a narrow factor range, which is true in this case. Further, the concept of power in a mixture experiment is difficult to think through. Power is the probability of detecting a real effect. If X3 has an effect, doesn't it make sense that the other factors (at least in combination) have an effect since they must change in relation to X3? People often think of the power as if the factors are independent when they are not.
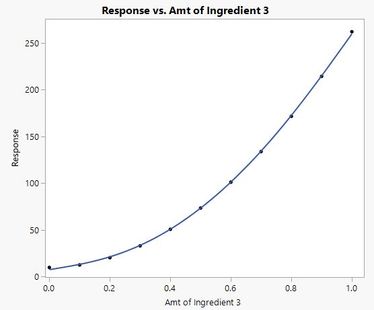
Finally, remember that the two-way terms are quadratic terms in the Scheffe mixture model and describe curvature along the edge of your experimentation window. Along that edge, in an unconstrained case, you may have a shape that looks like this:
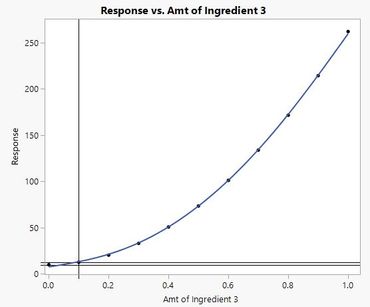
This is indeed a large effect. However, because you are restricting the range to (roughly) 0 to 0.1, you are really estimating this shape:
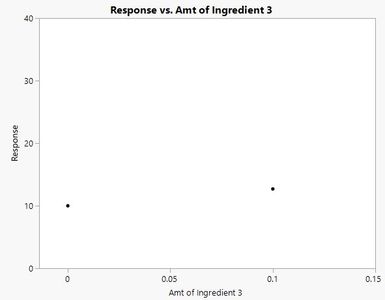
which does not look much better, even when zoomed in:
What looks like a large effect, may not be as large as you think due to the interplay with other factors and the restricted range. Put another way, the model would have a difficult time distinguishing between a pure linear model or a pure quadratic model -- they are indistinguishable over this narrow range. Replication alone is not going to adequately fix this kind of issue.
So, power is a good thing, but in many mixture experiments the focus is more on predicting the response. As Mark said, you can get very good predictive models even with low power.
- Mark as New
- Bookmark
- Subscribe
- Mute
- Subscribe to RSS Feed
- Get Direct Link
- Report Inappropriate Content
Re: Why is the power of my mixture design so low, even with an effect size of 20 standard deviations?
JMP codes the variables as pseudo-components by subtracting the minimum. I thought that would solve the problems related to the restricted range.
- Mark as New
- Bookmark
- Subscribe
- Mute
- Subscribe to RSS Feed
- Get Direct Link
- Report Inappropriate Content
Re: Why is the power of my mixture design so low, even with an effect size of 20 standard deviations?
Pseudocomponent coding will make the ranges as large as possible, but it still may not be very large. You can only do so much for narrow ranges. It is very possible that the modeling would not be able to distinguish between a pure linear model (for two components: Y=B1*X1 + B2*X2) and a pure quadratic model (Y=B11*X1*X2). You cannot determine which effects in the model are real because they are interrelated, and look extremely similar, especially over the chosen range. Hence, low power.
- Mark as New
- Bookmark
- Subscribe
- Mute
- Subscribe to RSS Feed
- Get Direct Link
- Report Inappropriate Content
Re: Why is the power of my mixture design so low, even with an effect size of 20 standard deviations?
Really great advice from both Mark and Dan! Key point about mixture designs (or any optimization design strategy) is, in theory, you have already screened out unimportant variables (perhaps through multiple iterations, starting with bold level settings) and you are now trying to optimize one (or likely more) response variables. Statistical significance (and related statistics) are no longer as important. Typically, coefficients are compared to each other to determine relative importance, however in mixture experiments, the order of the term impacts the relative importance. Also X1X2 is not interpreted as an interaction, but as a non-linear blending relationship (I think of it as departure from linear).
Recommended Articles
- © 2025 JMP Statistical Discovery LLC. All Rights Reserved.
- Terms of Use
- Privacy Statement
- Contact Us


