- New to JMP? Join us Sept. 23-24 for the Early User Edition of Discovery Summit, tailor-made for new users. Register now for free!
- Your voice matters! Tell us how you prefer to receive JMP updates, so we can tailor our communication to your needs. Take short survey.
- See how to access JMP Marketplace - and - find, create & share add-ins to extend your JMP. Watch video.
- Subscribe to RSS Feed
- Mark Topic as New
- Mark Topic as Read
- Float this Topic for Current User
- Bookmark
- Subscribe
- Mute
- Printer Friendly Page
Discussions
Solve problems, and share tips and tricks with other JMP users.- JMP User Community
- :
- Discussions
- :
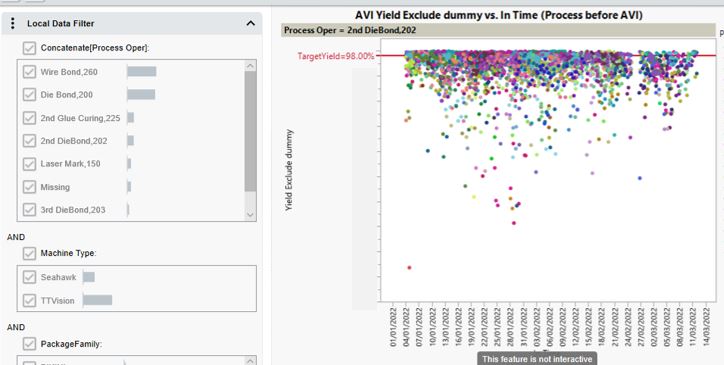
- Why Local Filter not interactive with Top Report (JMP15)

- Mark as New
- Bookmark
- Subscribe
- Mute
- Subscribe to RSS Feed
- Get Direct Link
- Report Inappropriate Content
Why Local Filter not interactive with Top Report (JMP15)
I couldn't understand why this script didn't work (local filter & .html graph not interactive).
I have another interactive graph build using similar logic and didn't have any issue.
I added the top report too.
Any idea?
//create Graph Builder
Names Default To Here( 1 );
dt3 = Data Table( "JoinT" );
gb = dt3 << Graph Builder(
	Size( 605, 3451 ),
	Show Control Panel( 0 ),
	Lock Scales( 1 ),
	Link Page Axes( "X and Y" ),
	Variables(
		X( :In Time ),
		Y( :Yield Exclude dummy ),
		Page( :Process Oper ),
		Overlay( :Process Mach No )
	),
	Elements( Points( X, Y, Legend( 9 ) ) ),
	Local Data Filter(
		Add Filter(
			columns(
				Transform Column(
					"Concatenate[Process Oper]",
					Character,
					Formula( Concat( :Process Oper ) )
				),
				:Machine Type,
				:PackageFamily,
				:Machine No,
				:Recipe,
				:Process Mach No
			),
			Display(
				Transform Column(
					"Concatenate[Process Oper]",
					Character,
					Formula( Concat( :Process Oper ) )
				),
				"Single Category Display"
			),
			Display( :PackageFamily, "Single Category Display" ),
			Display(
				:Machine No,
				"Single Category Display",
				Find( Set Text( "" ) )
			),
			Display( :Recipe, "Single Category Display", Find( Set Text( "" ) ) ),
			Display(
				:Process Mach No,
				"Single Category Display",
				Find( Set Text( "" ) )
			),
			Order By Count(
				Transform Column(
					"Concatenate[Process Oper]",
					Character,
					Formula( Concat( :Process Oper ) )
				)
			)
		)
	),
	SendToReport(
		Dispatch(
			{},
			"In Time",
			ScaleBox,
			{Format( "d/m/y", 10 ), Min( 3723595037 ), Max( 3730267481.28 ),
			Interval( "Day" ), Inc( 1 ), Minor Ticks( 0 )}
		),
		Dispatch(
			{},
			"In Time",
			ScaleBox( 2 ),
			{Format( "d/m/y", 10 ), Min( 3723840000 ), Max( 3730079028.96 ),
			Interval( "Day" ), Inc( 10 ), Minor Ticks( 0 )}
		),
		Dispatch(
			{},
			"In Time",
			ScaleBox( 3 ),
			{Format( "d/m/y", 10 ), Min( 3723796743.08 ), Max( 3725242379.92 ),
			Interval( "Day" ), Inc( 2 ), Minor Ticks( 1 )}
		),
		Dispatch(
			{},
			"In Time",
			ScaleBox( 4 ),
			{Format( "d/m/y", 10 ), Min( 3723840000 ), Max( 3730002981.72 ),
			Interval( "Day" ), Inc( 10 ), Minor Ticks( 0 )}
		),
		Dispatch(
			{},
			"In Time",
			ScaleBox( 5 ),
			{Format( "d/m/y", 10 ), Min( 3723840000 ), Max( 3730063004.8 ),
			Interval( "Day" ), Inc( 10 ), Minor Ticks( 0 )}
		),
		Dispatch(
			{},
			"In Time",
			ScaleBox( 6 ),
			{Format( "d/m/y", 10 ), Min( 3723840000 ), Max( 3730200253.12 ),
			Interval( "Day" ), Inc( 10 ), Minor Ticks( 0 )}
		),
		Dispatch(
			{},
			"In Time",
			ScaleBox( 7 ),
			{Format( "d/m/y", 10 ), Min( 3723840000 ), Max( 3730020656.4 ),
			Interval( "Day" ), Inc( 10 ), Minor Ticks( 0 )}
		),
		Dispatch(
			{},
			"In Time",
			ScaleBox( 8 ),
			{Format( "d/m/y", 10 ), Min( 3723595299.52 ), Max( 3730267481.28 ),
			Interval( "Day" ), Inc( 10 ), Minor Ticks( 0 )}
		),
		Dispatch(
			{},
			"Yield Exclude dummy",
			ScaleBox,
			{Format( "Fixed Dec", 15, 2 ), Min( 0 ), Max( 105 ), Inc( 10 ),
			Minor Ticks( 1 ), Add Ref Line(
				98,
				"Solid",
				"Medium Dark Red",
				"TargetYield=98.00%",
				2
			)}
		),
		Dispatch(
			{},
			"Yield Exclude dummy",
			ScaleBox( 2 ),
			{Format( "Fixed Dec", 15, 0 ), Min( 13.63 ), Max( 102.111427606729 ),
			Inc( 10 ), Minor Ticks( 0 )}
		),
		Dispatch(
			{},
			"Yield Exclude dummy",
			ScaleBox( 3 ),
			{Format( "Fixed Dec", 15, 1 ), Min( 97.970970312416 ),
			Max( 99.8921310582744 ), Inc( 0.5 ), Minor Ticks( 1 )}
		),
		Dispatch(
			{},
			"Yield Exclude dummy",
			ScaleBox( 4 ),
			{Format( "Fixed Dec", 15, 1 ), Min( 95.8240945419339 ),
			Max( 100.016768985686 ), Inc( 0.5 ), Minor Ticks( 0 )}
		),
		Dispatch(
			{},
			"Yield Exclude dummy",
			ScaleBox( 5 ),
			{Format( "Fixed Dec", 15, 1 ), Min( 95.8220034130674 ),
			Max( 100.057545297737 ), Inc( 0.5 ), Minor Ticks( 0 )}
		),
		Dispatch(
			{},
			"Yield Exclude dummy",
			ScaleBox( 6 ),
			{Format( "Fixed Dec", 15, 0 ), Min( 4.52872 ), Max( 103.59928 ),
			Inc( 10 ), Minor Ticks( 0 )}
		),
		Dispatch(
			{},
			"Yield Exclude dummy",
			ScaleBox( 7 ),
			{Format( "Fixed Dec", 15, 0 ), Min( 43.0752 ), Max( 101.7948 ),
			Inc( 10 ), Minor Ticks( 1 )}
		),
		Dispatch(
			{},
			"Yield Exclude dummy",
			ScaleBox( 8 ),
			{Format( "Fixed Dec", 15, 0 ), Min( 4.52792 ), Max( 103.62008 ),
			Inc( 10 ), Minor Ticks( 0 )}
		),
		Dispatch(
			{},
			"graph title",
			TextEditBox,
			{Set Text( "AVI Yield Exclude dummy vs. In Time (Process before AVI)" )}
		)
	)
);
gb << Bring Window to Front;
//Get the container of the platform
tr = gb << Top Report;
tr << Save Interactive HTML("C:\Users\jmpuser2020c\Desktop\Manufacturing Yield Dashboard\AVI\AVIAutoReport\ProcessBeforeMCAVIYield.html");
- Mark as New
- Bookmark
- Subscribe
- Mute
- Subscribe to RSS Feed
- Get Direct Link
- Report Inappropriate Content
Re: Why Local Filter not interactive with Top Report (JMP15)
Hi @WebDesignesCrow ,
Thank you for posting this question.
You're script is probably generating a Local Data Filter that uses features or a combination of conditions not supported by Interactive HTML.
Please check the output in JMP's Log (View>Log on Windows, Window>Log on Mac) after you run the script. You should see one or more lines starting with "Interactive HTML:"
If you copy these lines in a reply here, I may be able to find a way to write the script differently to avoid the conditions that are causing the local data filter to become non-interactive.
Thanks,
~John
- Mark as New
- Bookmark
- Subscribe
- Mute
- Subscribe to RSS Feed
- Get Direct Link
- Report Inappropriate Content
Re: Why Local Filter not interactive with Top Report (JMP15)
Hi John,
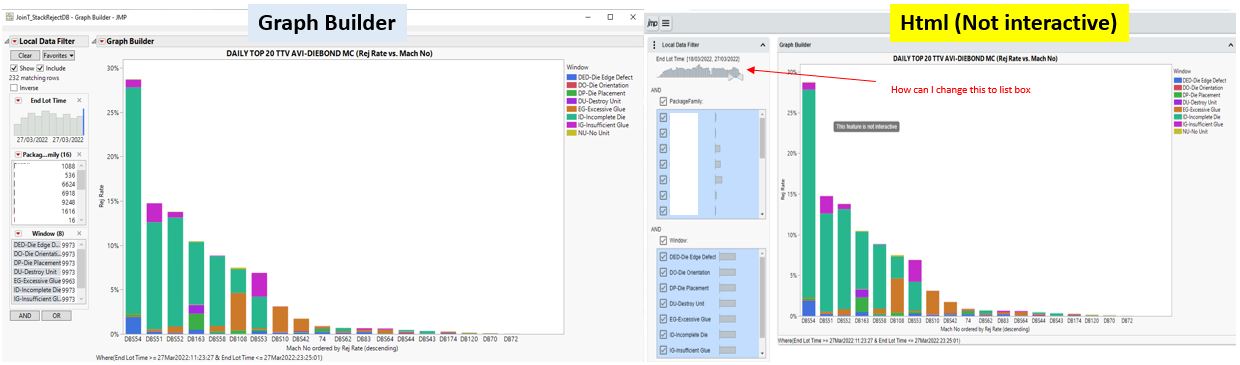
Thank you. For above interactive graphs, I managed to solve it by replacing combination with formula as per your recommendation in other thread & it works. Why my saved Interactive Html (Graph Builder) & Local Filter not interactive?
But, I was given a new project which faced quite similar issue.
(my boss already impressed with previous .html interactive graphs and wants me to explore other interactive Pareto charts using JMP 15 rather than work with Excel Dashboard).
I'm able to construct using graph builder function but when I save to .html it is not interactive.
1) I suspect due to the End Lot Time Local data filter (Slider)
I cannot change the date slider to "List Box" selection. Well, slider is not friendly for me when basically we just want to tick 1 date from 7 dates.
I'm looking for "List Box" selection for End Lot Time (since I just want to extract latest 7 days from today aggregated and user can tick which day they want to view for Daily report). I want the date to be something like below;

2) Could it be due to aggregation?
Is there any way I could make it interactive in .html?
The graph builder mode looks great.
The logs as below;
Interactive HTML: Values excluded by the data filter are not exported.
Interactive HTML: Controls are not interactive.
Interactive HTML: Unsupported display type: Box
Interactive HTML: Unsupported display type: ListBoxBox
Interactive HTML: Graphs with ordered X variables are not interactive.
Interactive HTML: Graphs with statistic "% of Grand Total" are not interactive.
Created Web Page.
Photos, log & script as per attached
- Mark as New
- Bookmark
- Subscribe
- Mute
- Subscribe to RSS Feed
- Get Direct Link
- Report Inappropriate Content
Re: Why Local Filter not interactive with Top Report (JMP15)
Hi @WebDesignesCrow ,
Thank you for the additional information. I'm not sure if I can give you a precise solution but some ideas to try.
The first thing I noticed is that you are excluding and hiding rows with the Local Data Filter. Interactive HTML will only be able to hide rows, because excluding them will require redoing the statistical calculations which requires the core statistics engine of JMP not available in Interactive HTML. We have product called JMP Live which allows Interactive HTML to call back to a JMP Server to perform the calculations after excluding rows. If hiding rows is all you need, I suggest disabling the Local Data Filter's Include mode before exporting to see what hiding without excluding will look like.
In order to have check boxes to select individual dates, you will need to convert the continuous date data into discrete (nominal or ordinal data) . You can achieve this by creating a new column with a formula to convert the date data to individual days. You may be able to find examples in this community or in our documentation.
To work around the limitations of:
Graphs with ordered X variables are not interactiveand:
Graphs with statistic "% of Grand Total" are not interactiveyou may be able to order the X variable by the statistic "% of Grand Total" before exporting.
It looks like your bar summary statistic is also set to "% of Grand Total". If "% of Total" will do, and the other limitations avoided, you should be able to get an interactive graph in Interactive HTML.
I hope this helps,
~John
- Mark as New
- Bookmark
- Subscribe
- Mute
- Subscribe to RSS Feed
- Get Direct Link
- Report Inappropriate Content
Re: Why Local Filter not interactive with Top Report (JMP15)
Hi John,
For local date data filter is successful after change to character.
I cannot change % of Grand total (which also depends on filtering), to % of Total since I need to view the stacked-bar charts in decreasing order. But, I understand your explanation regarding the statistical calculation which requires the core statistics engine in JMP and cannot be supported by html alone.
I'll check on JMP Live later if we really require that product.
Thanks!
- Mark as New
- Bookmark
- Subscribe
- Mute
- Subscribe to RSS Feed
- Get Direct Link
- Report Inappropriate Content
Re: Why Local Filter not interactive with Top Report (JMP15)
Hi @WebDesignesCrow,
I wish I had a work around for the % of Grand Total limitation. Speaking of wishes, when you run into limitations like this one, please feel free to enter a wish at the JMP Wish List to have it implemented in our Interactive HTML offering. We use this list in addition to requests received by our technical support team to prioritize what we support.
You can learn about JMP Live here.
Thanks,
~John
Recommended Articles
- © 2026 JMP Statistical Discovery LLC. All Rights Reserved.
- Terms of Use
- Privacy Statement
- Contact Us