- Instantly extract effect sizes, F-ratios, and FDR-adjusted p-values from your models with the Calculate Effects Sizes extension, available now in the JMP Marketplace!
- New to JMP? Join us Sept. 23-24 for the Early User Edition of Discovery Summit, tailor-made for new users. Register now for free!
- See how to use the JMP Marketplace – Free tools to expand JMP capabilities. Register. July 10, 2 pm US Eastern Time.
- Subscribe to RSS Feed
- Mark Topic as New
- Mark Topic as Read
- Float this Topic for Current User
- Bookmark
- Subscribe
- Mute
- Printer Friendly Page
Discussions
Solve problems, and share tips and tricks with other JMP users.- JMP User Community
- :
- Discussions
- :
- Weight of specific group of data in whole dataset

- Mark as New
- Bookmark
- Subscribe
- Mute
- Subscribe to RSS Feed
- Get Direct Link
- Report Inappropriate Content
Weight of specific group of data in whole dataset
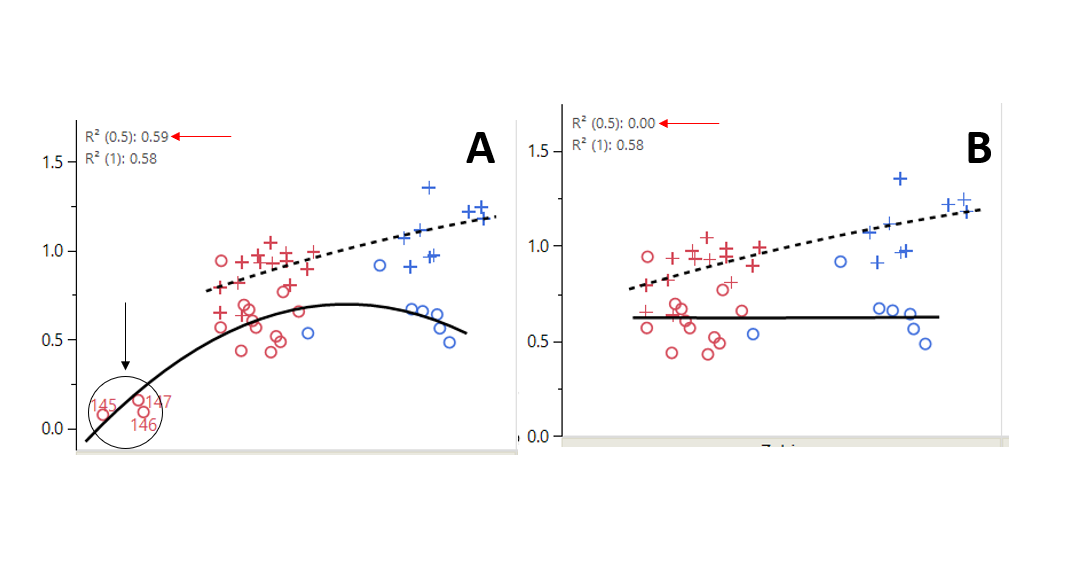
In the image attached, I am trying to find out or rather calculate weight of the set of variables in circle in (A). When it is included in the data set it gives an R-sq of 0.59, however, when it is excluded the coefficient reduces to the minimum (B).
How can give a weighted value to the dataset, as I would like to exclude it from the dataset while showing and explaining on valid reasons why it is excluded?
- Tags:
- windows
Accepted Solutions

- Mark as New
- Bookmark
- Subscribe
- Mute
- Subscribe to RSS Feed
- Get Direct Link
- Report Inappropriate Content
Re: Weight of specific group of data in whole dataset
Other guess depending what you mean with the weight / exclusion:
Using big class as an example:
Red points are the ones I want to exclude from analysis (but still how them):
R2 = 0.559

Select them and just exclude (don't hide):

They will disappear from graph builder:
R2:0.351

Now HOLD SHIFT while clicking red triangle and it will show you hidden options (why are these hidden and are there more hidden options / list of hidden options some where?) (found from here). The excluded rows should be shown a bit transparent

R2:0.351


- Mark as New
- Bookmark
- Subscribe
- Mute
- Subscribe to RSS Feed
- Get Direct Link
- Report Inappropriate Content
Re: Weight of specific group of data in whole dataset
If I correctly understand what you want to do, all you have to do, is to go to the graph and drag and select the data values in question, and then right click on one of the selected points and in Graph Builder or Fit Y by X
Rows=>Hide and Exclude
- Mark as New
- Bookmark
- Subscribe
- Mute
- Subscribe to RSS Feed
- Get Direct Link
- Report Inappropriate Content
Re: Weight of specific group of data in whole dataset
Other guess depending what you mean with the weight / exclusion:
Using big class as an example:
Red points are the ones I want to exclude from analysis (but still how them):
R2 = 0.559
Select them and just exclude (don't hide):
They will disappear from graph builder:
R2:0.351
Now HOLD SHIFT while clicking red triangle and it will show you hidden options (why are these hidden and are there more hidden options / list of hidden options some where?) (found from here). The excluded rows should be shown a bit transparent
R2:0.351
- Mark as New
- Bookmark
- Subscribe
- Mute
- Subscribe to RSS Feed
- Get Direct Link
- Report Inappropriate Content
Re: Weight of specific group of data in whole dataset
Thank you, your resonspe helped in showing the group of excluded data. However, one of the lines of fit suddenly is not showing even when I redo the graph.
Also, the question was partly answered too, How can I do a statistical calculation to see how much this three group influenced the fit (which is an expected outcome), hence, one of the reasons I have excluded them?
Any idea how I can present this?
Recommended Articles
- © 2026 JMP Statistical Discovery LLC. All Rights Reserved.
- Terms of Use
- Privacy Statement
- Contact Us