- Don’t miss your chance to experience Discovery Summit Europe at our best available rate! Early bird registration through 31 Oct.
- Graph Builder Toolbar streamlines interactive graphing. Creates shortcuts on Report and GraphBuilder Helpers toolbars. Download and install the extension.
- JMP will suspend normal business operations for our Rest and Recharge Day on Friday, October 2, 2026.
Regular business hours will resume on Monday, October 5, 2026.
- Subscribe to RSS Feed
- Mark Topic as New
- Mark Topic as Read
- Float this Topic for Current User
- Bookmark
- Subscribe
- Mute
- Printer Friendly Page
Discussions
Solve problems, and share tips and tricks with other JMP users.- User Community
- :
- Discussions
- :
- Variable Y Reference line based on X


- Mark as New
- Bookmark
- Subscribe
- Mute
- Subscribe to RSS Feed
- Get Direct Link
- Report Inappropriate Content
Variable Y Reference line based on X
Is there a way to have a reference line either disappear at a certain X or change at a specific X? For instance
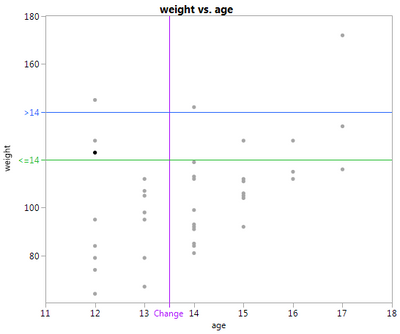
is it possible for green to go to blue at the purple line?
Accepted Solutions

- Mark as New
- Bookmark
- Subscribe
- Mute
- Subscribe to RSS Feed
- Get Direct Link
- Report Inappropriate Content
Re: Variable Y Reference line based on X
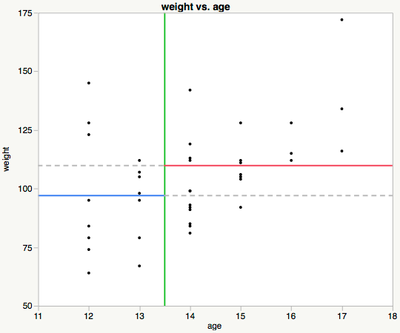
It can be done with a graphics script. Right click on the FrameBox and select Customize…
Or do it with jsl. For example:
dt = Open("$SAMPLE_DATA/Big Class.jmp");
Column("age") << set modeling type(continuous);
gb = dt << Graph Builder(Variables(X(:age), Y(:weight)), Elements(Points(X, Y, Legend(3))));
Report(gb)[Framebox(1)] << Add Graphics Script(
Description("reflines"),
bp = 13.5; //breakpoint
y1 = Mean(:weight[dt << get rows where(:age <= bp)]);
y2 = Mean(:weight[dt << get rows where(:age > bp)]);
Line(
Pen Size(2);
Pen Color("green");
{bp, Y Origin()};,
{bp, Y Range() + Y Origin()}
);
Line(
Pen Size(2);
Pen Color("blue");
{X Origin(), y1};,
{bp, y1}
);
Line(
Line Style(2);
Pen Size(2);
Pen Color("gray");
{bp, y1};,
{X Range() + X Origin(), y1}
);
Line(
Pen Size(2);
Pen Color("red");
{bp, y2};,
{X Range() + X Origin(), y2}
);
Line(
Line Style(2);
Pen Size(2);
Pen Color("gray");
{X Origin(), y2};,
{bp, y2}
);
);
- Mark as New
- Bookmark
- Subscribe
- Mute
- Subscribe to RSS Feed
- Get Direct Link
- Report Inappropriate Content
Re: Variable Y Reference line based on X
It can be done with a graphics script. Right click on the FrameBox and select Customize…
Or do it with jsl. For example:
dt = Open("$SAMPLE_DATA/Big Class.jmp");
Column("age") << set modeling type(continuous);
gb = dt << Graph Builder(Variables(X(:age), Y(:weight)), Elements(Points(X, Y, Legend(3))));
Report(gb)[Framebox(1)] << Add Graphics Script(
Description("reflines"),
bp = 13.5; //breakpoint
y1 = Mean(:weight[dt << get rows where(:age <= bp)]);
y2 = Mean(:weight[dt << get rows where(:age > bp)]);
Line(
Pen Size(2);
Pen Color("green");
{bp, Y Origin()};,
{bp, Y Range() + Y Origin()}
);
Line(
Pen Size(2);
Pen Color("blue");
{X Origin(), y1};,
{bp, y1}
);
Line(
Line Style(2);
Pen Size(2);
Pen Color("gray");
{bp, y1};,
{X Range() + X Origin(), y1}
);
Line(
Pen Size(2);
Pen Color("red");
{bp, y2};,
{X Range() + X Origin(), y2}
);
Line(
Line Style(2);
Pen Size(2);
Pen Color("gray");
{X Origin(), y2};,
{bp, y2}
);
);
- Mark as New
- Bookmark
- Subscribe
- Mute
- Subscribe to RSS Feed
- Get Direct Link
- Report Inappropriate Content
Re: Variable Y Reference line based on X
Oh yeah. I always forget that I can just draw. Much appreciated.
Recommended Articles
- © 2026 JMP Statistical Discovery LLC. All Rights Reserved.
- Terms of Use
- Privacy Statement
- Contact Us