- JMP will suspend normal business operations for our Winter Holiday beginning on Wednesday, Dec. 24, 2025, at 5:00 p.m. ET (2:00 p.m. ET for JMP Accounts Receivable).
Regular business hours will resume at 9:00 a.m. EST on Friday, Jan. 2, 2026. - We’re retiring the File Exchange at the end of this year. The JMP Marketplace is now your destination for add-ins and extensions.
- Subscribe to RSS Feed
- Mark Topic as New
- Mark Topic as Read
- Float this Topic for Current User
- Bookmark
- Subscribe
- Mute
- Printer Friendly Page
Discussions
Solve problems, and share tips and tricks with other JMP users.- JMP User Community
- :
- Discussions
- :
- Unbalanced Control Treatment

- Mark as New
- Bookmark
- Subscribe
- Mute
- Subscribe to RSS Feed
- Get Direct Link
- Report Inappropriate Content
Unbalanced Control Treatment
I have 4 N Rates (0, 140, 168, 224) and three N sources (CRU-60, CRU-75, U)
Control or 0 N rate has no source attached to it as no fertilizer gets applied
When I run the main and interaction effects, the control does not get analyzed. Additionally, when I look at my anova, am I to expect to see a model with a df of 9 (3 N rate*3 N source + control)? If so, I am not getting that. I uploaded an example of how I set up the data. Not sure what to put under the N source column for 0 N rate. My response variable is SorTC. Ultimately I would like to run a tukey analysis where the control can be evaluated against the fertilized treatments. Please advice. Thank you!

- Mark as New
- Bookmark
- Subscribe
- Mute
- Subscribe to RSS Feed
- Get Direct Link
- Report Inappropriate Content
Re: Unbalanced Control Treatment
Hello @MANOVALogKoala1,
Could you please describe which platform do you use (I guess "Fit Model" for detecting main effects and interactions, and "Fit Y by X" for ANOVA ?) ? It may also be wiser to add "0" in your control source, so that your control group is not considered as "missing value" (and stop you from looking at the control results in the different platforms).
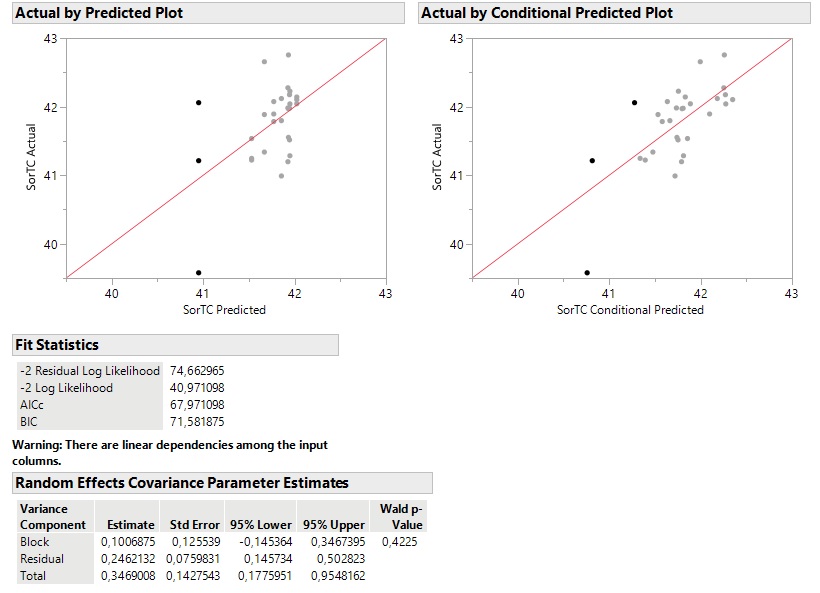
- For the platform "Fit Model" I don't have enough informations about the modeling options you have chosen, but a good start would be to test if your block effect is significant or not through the "Mixed Model" personality. You can add a column property in your "Block column" by adding the "Design role" : blocking, and changing the data type from numeric continuous to numeric nominal. Then, you list your effect : N rate, N source and N rate x N source, and you add your "Block" column as a "Random Effect".
When you launch the analysis, you should have this screen (see Mixed_model_test image). Looking at the Wald p-value, your blocking parameter doesn't look significant, so it may be removed in further analysis (for example in relaunching the "Fit Model" platform with different personality, like Standard Least Squares (JMP) or Generalized Regression (JMP Pro) with the correct response distribution in the "Distribution" option (in your test data, response distribution looks like Weibull distribution).
- For the platform "Fit Y by X" (ANOVA), you have the choice depending on your goal :
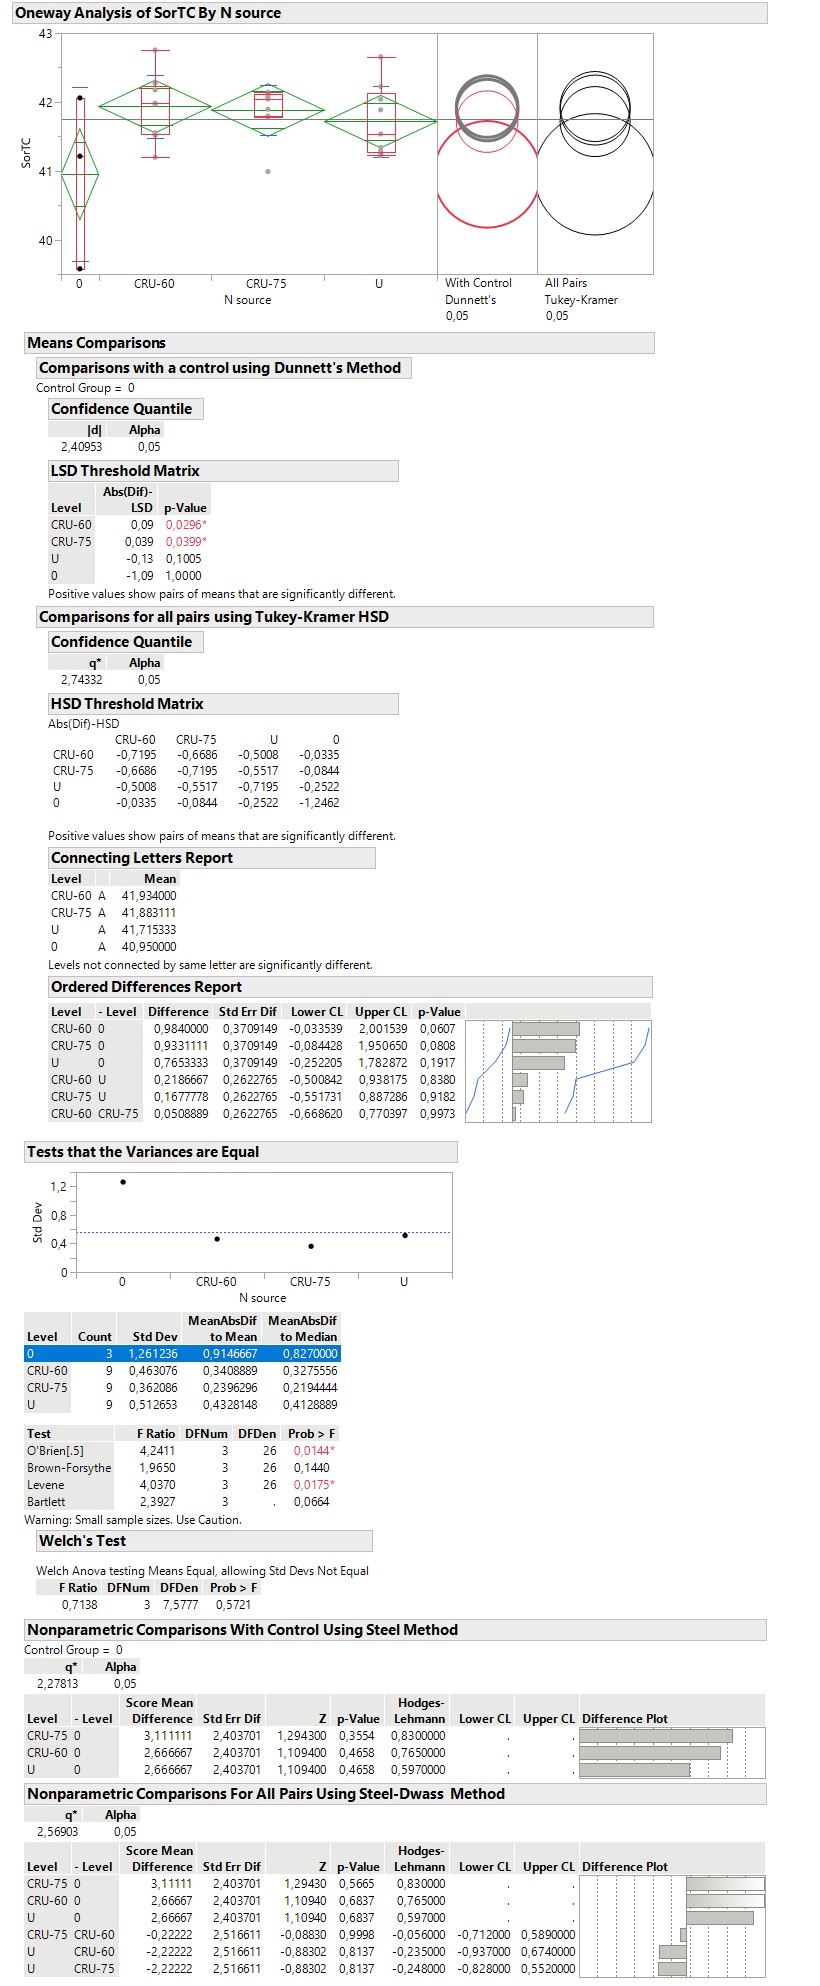
- If your goal is to compare effect of source vs. a control source 0, then you can choose Dunnett's test, which will only compare each candidate source with the control group 0. It will not do comparisons between candidate sources.
- If your goal is to compare each source effect depending on the response, then Tukey may be appropriate (see image).
Be careful in your analysis with "Fit Y by X", as Tukey or Dunnett tests are parametric tests, so you need to verify three assumptions in your data : independence of observations, normality (or close to normality), and equal variances. Here, looking at the test data, equal variances might not be respected (that might be due to low samples sizes), and you have only an approximate normality when looking at Normal Quantile Plot. To have more confidence in your statistical testing, I would recommend using non-parametrical tests : Steel with Control (non-parametric equivalent to Dunnett) or Steel-Dwass, All Pairs (non parametric equivalent to Tukey test).
I hope it will help you,
"It is not unusual for a well-designed experiment to analyze itself" (Box, Hunter and Hunter)
- Mark as New
- Bookmark
- Subscribe
- Mute
- Subscribe to RSS Feed
- Get Direct Link
- Report Inappropriate Content
Re: Unbalanced Control Treatment
Thank you for your response! I am using Fit Model to detect the main effects and interactions between N rate and N source and I am using the personality Standard Least squares. I ran the analysis without the block for now just to see the ANOVA for the main and interaction, which looks correct for the model DF which is 9 (pdf is attached). I ran Tukey for all main and interaction to show that the comparisons that I am looking for are displayed for each effect, which is great. The only problem is that the degrees of freedom are lost for the N rate and source and therefore the analysis is not working out. I like how in your one-way analysis you had the control act as a source effect. How do I get the control to act as a source and rate effect in my model when using Fit Model? If possible, please advice. Thanks!
- Mark as New
- Bookmark
- Subscribe
- Mute
- Subscribe to RSS Feed
- Get Direct Link
- Report Inappropriate Content
Re: Unbalanced Control Treatment
Ok thanks for the infos !
Not sure what you mean by "correct", but looking at your standard least squares model, it seems that your model is not significant (and neither are the main effects and interaction, way above the common significance threshold of 0.05).
Only 34% of the variability in the data is explained by this model, which is quite low.
Looking at the values for the different combinations (and tests I previously did in a bivariate analysis), you might not have significant effects for your source and N rate parameters.
Since you have not enough DF, you might try to relaunch the analysis in a stepwise manner, or simply without the interaction (just looking at the main effects first).
But once again, there is no clear trend on this test data set, so I clearly think there is either not enough data to detect this small effect size, or there are simply no significant effect.
With the different statistical reports and your domain expertise, you will be able to understand and decide what to do next.
"It is not unusual for a well-designed experiment to analyze itself" (Box, Hunter and Hunter)
Recommended Articles
- © 2025 JMP Statistical Discovery LLC. All Rights Reserved.
- Terms of Use
- Privacy Statement
- Contact Us