- DownloadSemiconductor Toolkit: Tools to create wafer maps, add wafer geometry to graphics, explore die defects & compare wafers.
- Discovery Summit 2026: Early User Edition - September 23-24.Register. It's free.
- See how to design an experiment, explore factor-response relationships, assess tradeoffs, and ID best settings. Register for Sep. 11 Mastering JMP.
- Subscribe to RSS Feed
- Mark Topic as New
- Mark Topic as Read
- Float this Topic for Current User
- Bookmark
- Subscribe
- Mute
- Printer Friendly Page
Discussions
Solve problems, and share tips and tricks with other JMP users.- User Community
- :
- Discussions
- :
- Re: To set range in overlay

- Mark as New
- Bookmark
- Subscribe
- Mute
- Subscribe to RSS Feed
- Get Direct Link
- Report Inappropriate Content
To set range in overlay
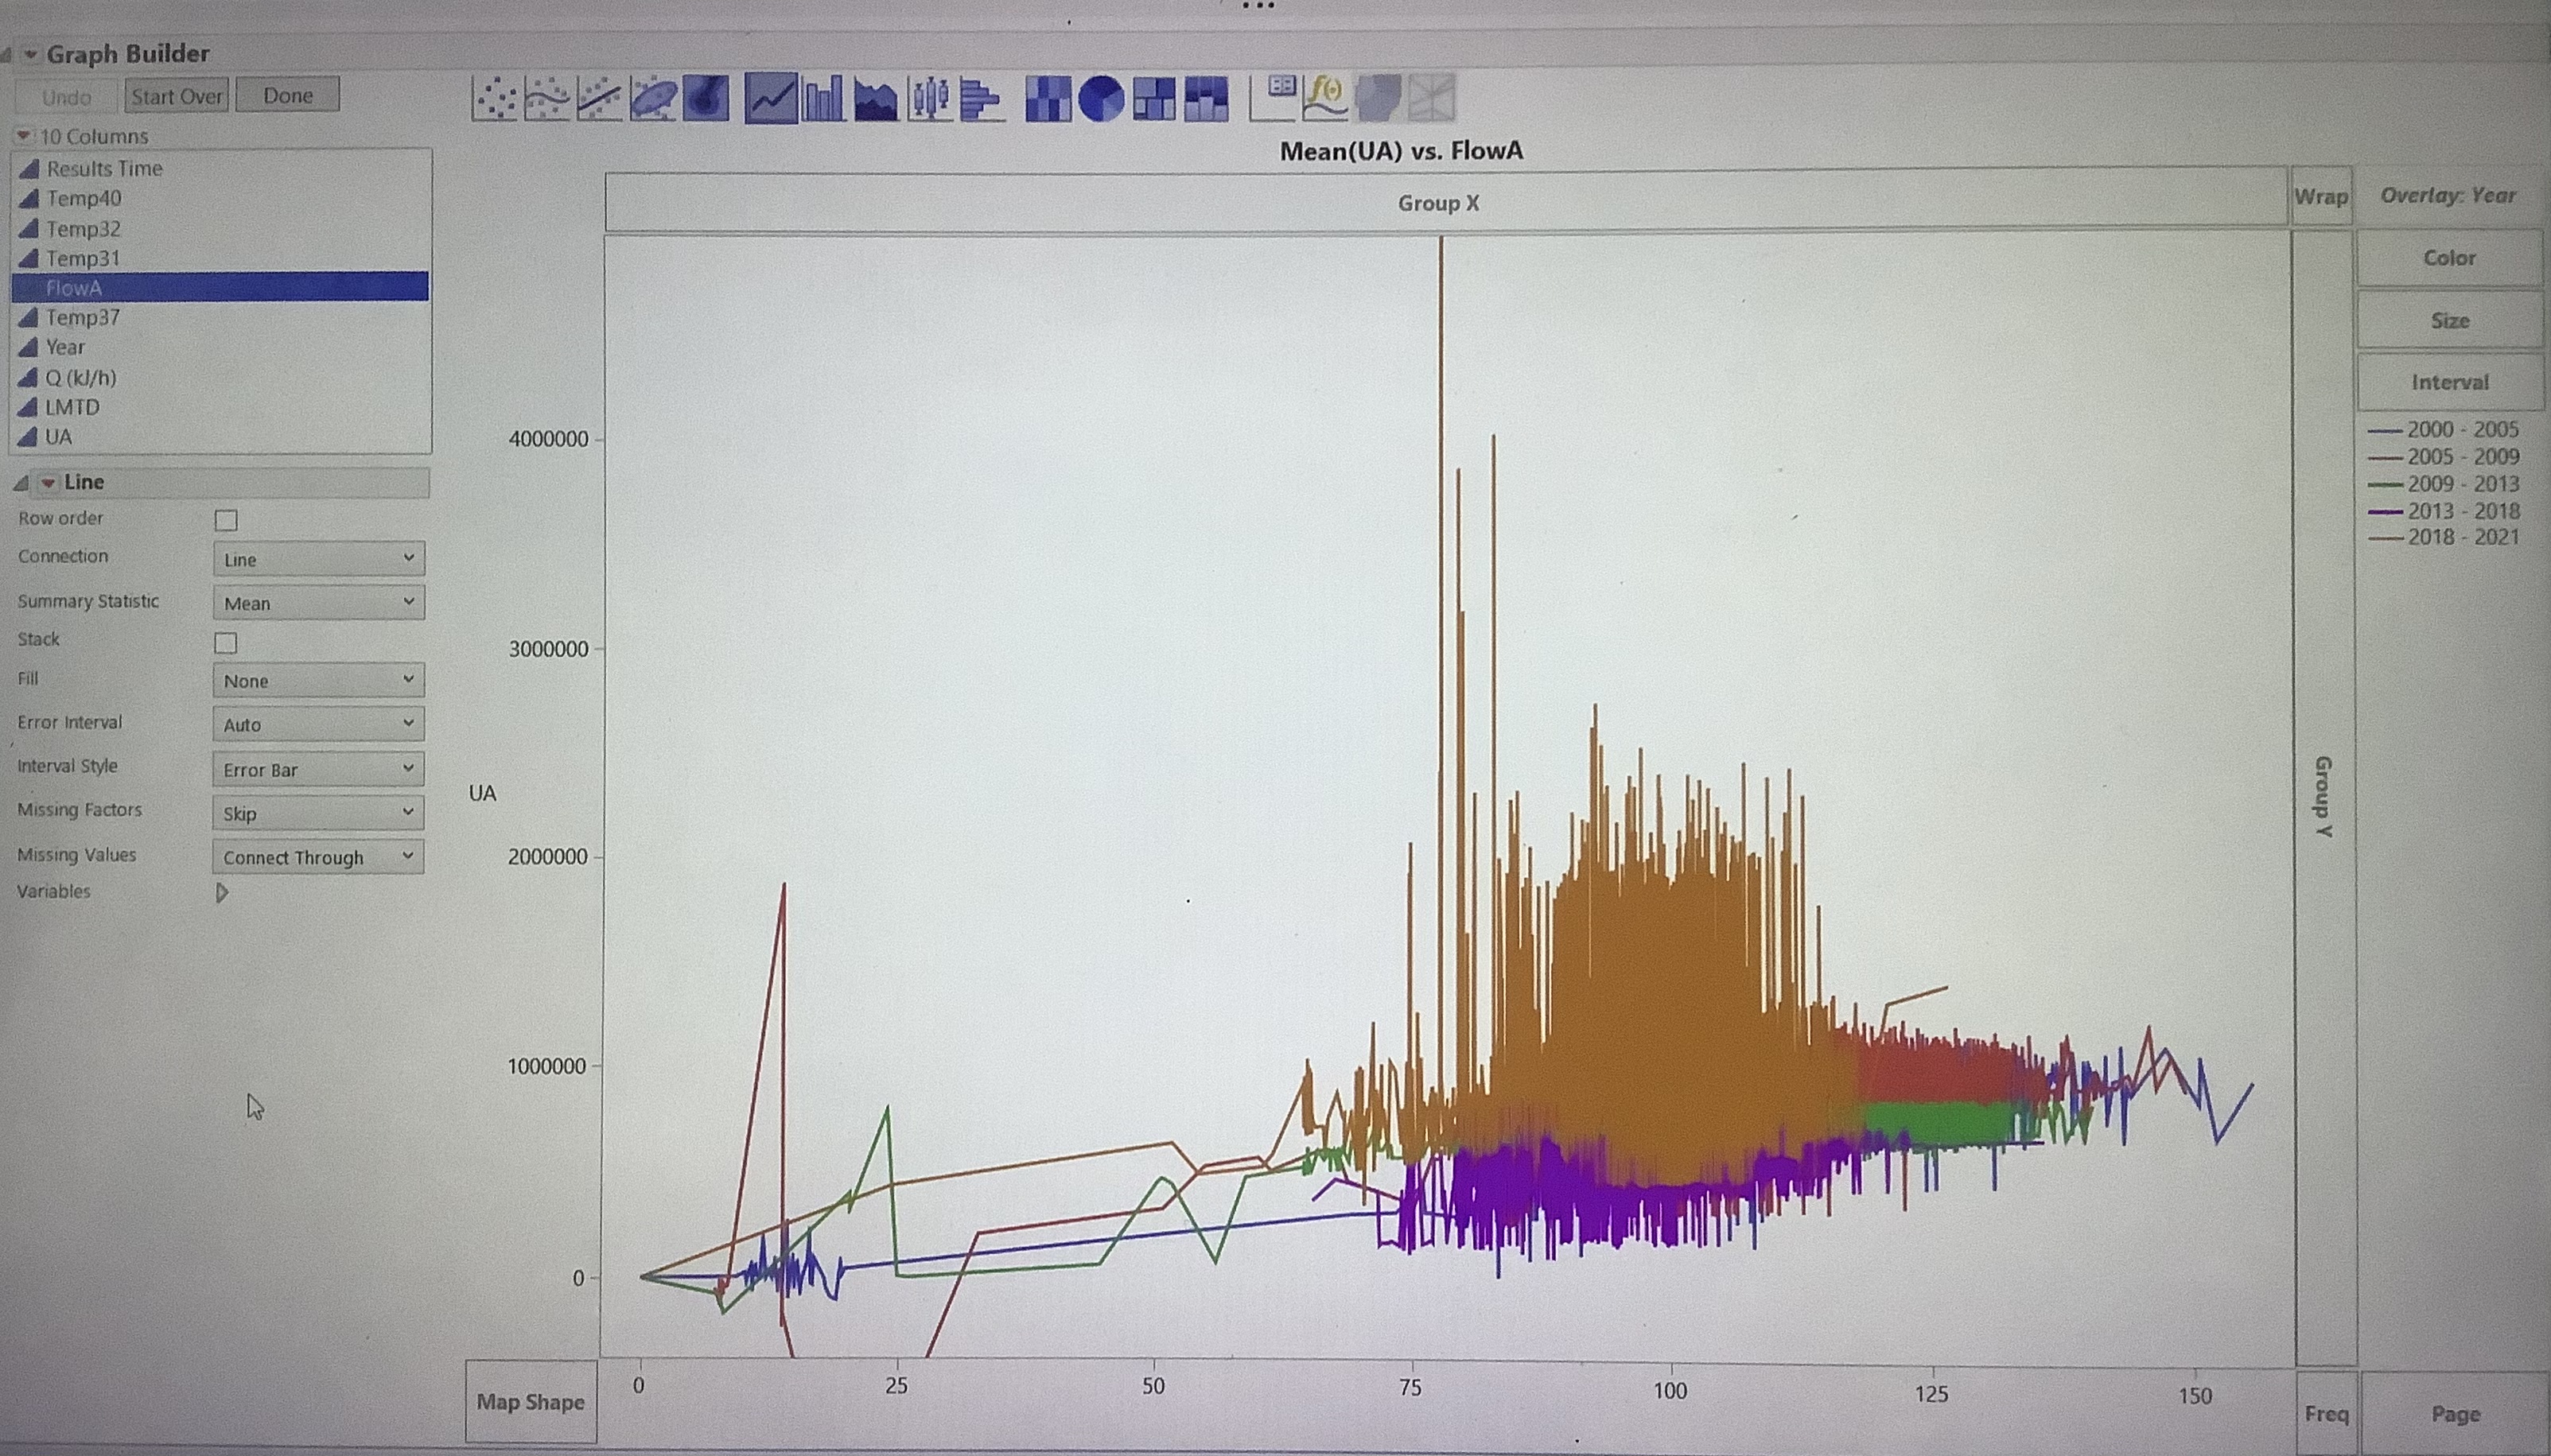
I have a data and I want to see scatter plot trend overlay by year. Ive created a year formula, but after I drag it to overlay, it creates a default 5 years range. How can I define my own range when I overlay the trend?
Accepted Solutions


- Mark as New
- Bookmark
- Subscribe
- Mute
- Subscribe to RSS Feed
- Get Direct Link
- Report Inappropriate Content
Re: To set range in overlay
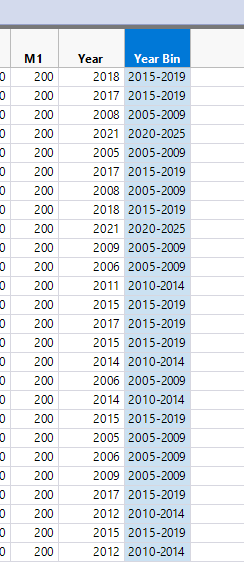
Just create a new column, in my example I call it Year Bin. Use the formula:
If(
	:Year < 2010, "2005-2009",
	:Year < 2015, "2010-2014",
	:Year < 2020, "2015-2019",
	:Year < 2025, "2020-2025"
)
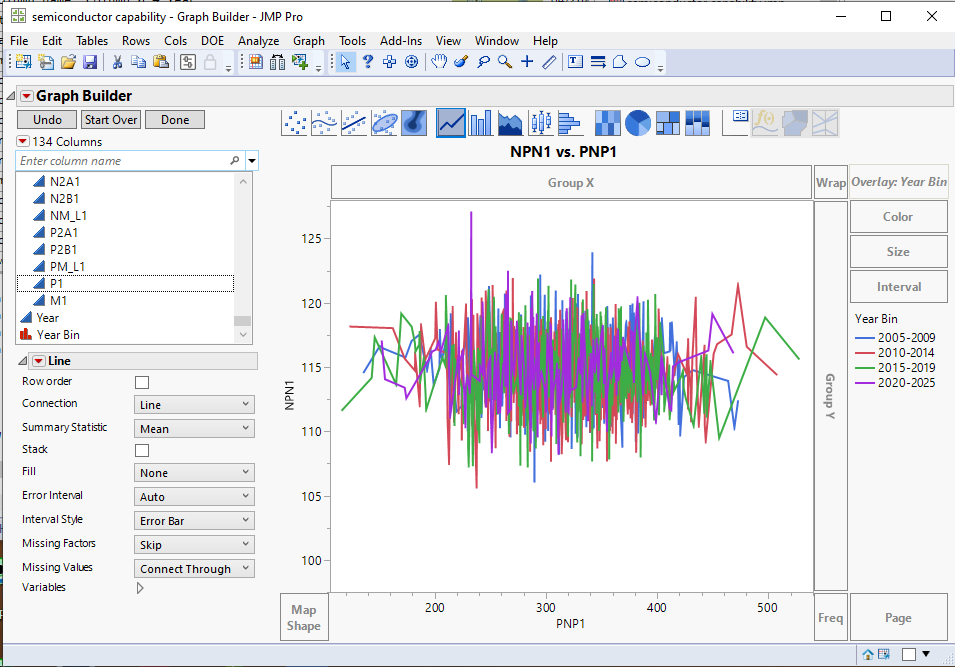
Which yields the following graph with the year bins as defined in the formula

- Mark as New
- Bookmark
- Subscribe
- Mute
- Subscribe to RSS Feed
- Get Direct Link
- Report Inappropriate Content
Re: To set range in overlay
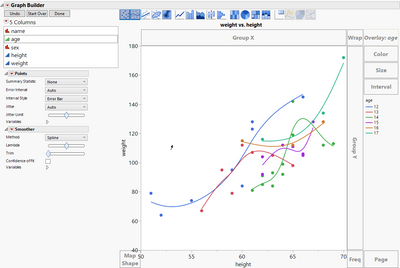
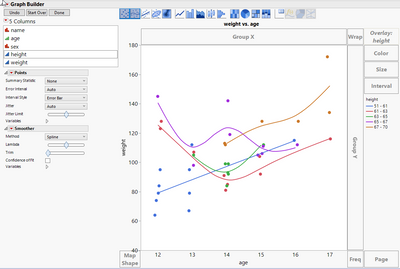
Can you show us the feature you are looking for in a screen shot?
There is a difference if the column used in overlay is ordinal or continuous
- Mark as New
- Bookmark
- Subscribe
- Mute
- Subscribe to RSS Feed
- Get Direct Link
- Report Inappropriate Content
Re: To set range in overlay
It’s continuous and rather than having it range from 2000-2005, but I want to see every year data ->2000, 2001, 2002, etc
- Mark as New
- Bookmark
- Subscribe
- Mute
- Subscribe to RSS Feed
- Get Direct Link
- Report Inappropriate Content
Re: To set range in overlay
It would be my suggestion to create a new column that assigns the ranges to specific bin values, and then use that column as the overlay column.
- Mark as New
- Bookmark
- Subscribe
- Mute
- Subscribe to RSS Feed
- Get Direct Link
- Report Inappropriate Content
Re: To set range in overlay
Please could you elaborate further how to formulate that in a column? Thank you
- Mark as New
- Bookmark
- Subscribe
- Mute
- Subscribe to RSS Feed
- Get Direct Link
- Report Inappropriate Content
Re: To set range in overlay
Just create a new column, in my example I call it Year Bin. Use the formula:
If(
	:Year < 2010, "2005-2009",
	:Year < 2015, "2010-2014",
	:Year < 2020, "2015-2019",
	:Year < 2025, "2020-2025"
)
Which yields the following graph with the year bins as defined in the formula
- Mark as New
- Bookmark
- Subscribe
- Mute
- Subscribe to RSS Feed
- Get Direct Link
- Report Inappropriate Content
Re: To set range in overlay
Recommended Articles
- © 2026 JMP Statistical Discovery LLC. All Rights Reserved.
- Terms of Use
- Privacy Statement
- Contact Us