- Subscribe to RSS Feed
- Mark Topic as New
- Mark Topic as Read
- Float this Topic for Current User
- Bookmark
- Subscribe
- Mute
- Printer Friendly Page
Discussions
Solve problems, and share tips and tricks with other JMP users.- JMP User Community
- :
- Discussions
- :
- Re: TWO Y VAR with different visulisation in graph builder

- Mark as New
- Bookmark
- Subscribe
- Mute
- Subscribe to RSS Feed
- Get Direct Link
- Report Inappropriate Content
TWO Y VAR with different visulisation in graph builder
hi all.
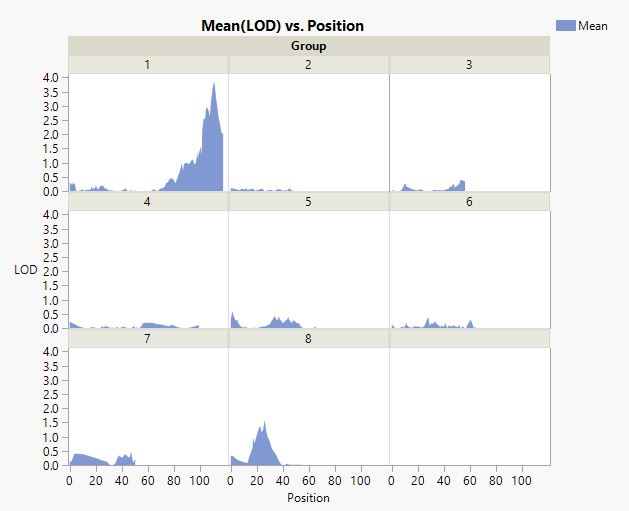
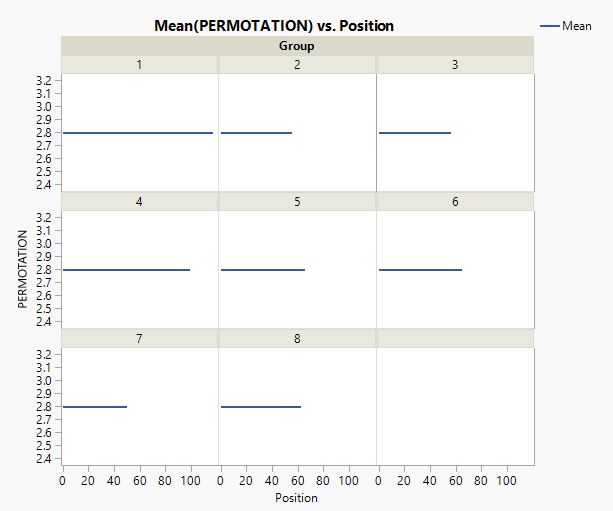
is there a way to visualised two different var at the y axes but each series in a different way
for example one var with the "area" plot while the second with the "line" presentation (same X axes)
thank you vary much. ( in short to combine the two graphs attached)
Accepted Solutions

- Mark as New
- Bookmark
- Subscribe
- Mute
- Subscribe to RSS Feed
- Get Direct Link
- Report Inappropriate Content
Re: TWO Y VAR with different visulisation in graph builder
You can do this by going to the configuration area in Graph Builder, for each of the types of displays you want and to change the "Variables" selection to indicate which of the variables you want to have for the specific type of display. Below is a graph that has both Height and Weight specified for the Y Axis. Both an Area and a Line display has been specified. For the Line graph, only the X axis variable, Age and the Y axis variable, Weight are selected. For the Area chart, only the Age and Height variables are selected.


- Mark as New
- Bookmark
- Subscribe
- Mute
- Subscribe to RSS Feed
- Get Direct Link
- Report Inappropriate Content
Re: TWO Y VAR with different visulisation in graph builder
Hi @hillel ,
One possible option is to move one of the Y variables to the right side of the graph and then select the line graph style in Graph Builder (the left Y variable will be the line). I was able to get this to work with the Big Class data set, graphing weight vs age and height vs age -- weight as the fill to bottom area under curve and then height as a red line, I even wrapped it by "sex", so it's something like your data. I changed the axes so that it kind of separated the weight/height data, so it's easier to see.
I've attached a screen shot of what Graph builder looks like.

This is one possible solution, but I'm sure there are others, and someone else is sure to have a better solution.
Hope this helps!,
DS
- Mark as New
- Bookmark
- Subscribe
- Mute
- Subscribe to RSS Feed
- Get Direct Link
- Report Inappropriate Content
Re: TWO Y VAR with different visulisation in graph builder
You can do this by going to the configuration area in Graph Builder, for each of the types of displays you want and to change the "Variables" selection to indicate which of the variables you want to have for the specific type of display. Below is a graph that has both Height and Weight specified for the Y Axis. Both an Area and a Line display has been specified. For the Line graph, only the X axis variable, Age and the Y axis variable, Weight are selected. For the Area chart, only the Age and Height variables are selected.
- Mark as New
- Bookmark
- Subscribe
- Mute
- Subscribe to RSS Feed
- Get Direct Link
- Report Inappropriate Content
Re: TWO Y VAR with different visulisation in graph builder
Hi @hillel ,
One possible option is to move one of the Y variables to the right side of the graph and then select the line graph style in Graph Builder (the left Y variable will be the line). I was able to get this to work with the Big Class data set, graphing weight vs age and height vs age -- weight as the fill to bottom area under curve and then height as a red line, I even wrapped it by "sex", so it's something like your data. I changed the axes so that it kind of separated the weight/height data, so it's easier to see.
I've attached a screen shot of what Graph builder looks like.
This is one possible solution, but I'm sure there are others, and someone else is sure to have a better solution.
Hope this helps!,
DS
Recommended Articles
- © 2026 JMP Statistical Discovery LLC. All Rights Reserved.
- Terms of Use
- Privacy Statement
- Contact Us