- Subscribe to RSS Feed
- Mark Topic as New
- Mark Topic as Read
- Float this Topic for Current User
- Bookmark
- Subscribe
- Mute
- Printer Friendly Page
Discussions
Solve problems, and share tips and tricks with other JMP users.- JMP User Community
- :
- Discussions
- :
- Adding the user-defined error interval option to the graph builder

- Mark as New
- Bookmark
- Subscribe
- Mute
- Subscribe to RSS Feed
- Get Direct Link
- Report Inappropriate Content
Adding the user-defined error interval option to the graph builder
Is it possible to plot the mean and then add a summary statistics from Points-Summary Statistic as a separate error interval, which you define Yourself?
Because calculating mean and SD in different columns in JMP is very easy, but then adding them together and plotting them as a dot and error bars does not function. And this is frankly very annoying because this feature is present in many other statistical softwares :).
Hereby is my suggestion for further JMP development - make a 'USER DEFINED STATISTICS' as a possibility to add as an error bar (Error Interval).
Then one could calculate and define SD separately in a separate column from a biological triplicate - and so plot them together on top of each other in all possible conditions and variations, voila.
I could see this feature is lacking for some time already (from discussion trends), and all alternatives to solve this issue around are very clumsy and code-requiring.
Thank you :)

- Mark as New
- Bookmark
- Subscribe
- Mute
- Subscribe to RSS Feed
- Get Direct Link
- Report Inappropriate Content
Re: Adding the user-defined error interval option to the graph builder
Have you seen the Interval drop zone in Graph Builder? I think this is what you are looking for:

- Mark as New
- Bookmark
- Subscribe
- Mute
- Subscribe to RSS Feed
- Get Direct Link
- Report Inappropriate Content
Re: Adding the user-defined error interval option to the graph builder
If so, how can you make it thicker and more visible in on the plot?
Because it appears super finely drawn and I cannot see it nicely.
What should I change in the general preferences to make it always happen - i.e. to always draw a thick line and visible end bars?
Thank you :).
- Mark as New
- Bookmark
- Subscribe
- Mute
- Subscribe to RSS Feed
- Get Direct Link
- Report Inappropriate Content
Re: Adding the user-defined error interval option to the graph builder
I have added the intervals as suggested, but frankly I do not understand what it is.
Now it is plotted as: Mean as a dot +/-SD as bars
And I have zoomed in the graph.
1. Why are they different widths? What else is plotted there as a thick line - a median or a mean of my SD? How do I get rid of it then?
2. Then, how does each bar relate to the mean - how are they connected, which mean belongs to which bars? Can one just make a line going through the center of the points as in all other stat softwares?
I cannot easily understand. I think this could be improved...?

- Mark as New
- Bookmark
- Subscribe
- Mute
- Subscribe to RSS Feed
- Get Direct Link
- Report Inappropriate Content
Re: Adding the user-defined error interval option to the graph builder
I can't really tell how you created your graph, but it looks like you do not have a grouping variable defined, so you are getting intervals for each data point. See this example:

I had a data table with 3 columns: Group, Y, and Interval.
I drug the Y column to the Y-axis. I then drug Group to the X-axis and Interval to the Interval role to create the graph. Note that the Interval column is only needed because you wanted a Custom interval. If you just want something standard, you can drag the Y variable into the Interval role and specify the statistic you want to create the interval.
I believe this is the type of interval graph that most people expect. Perhaps if you share a bit more of your problem setup (or a fictional example of your data), people will be able to help more.
- Mark as New
- Bookmark
- Subscribe
- Mute
- Subscribe to RSS Feed
- Get Direct Link
- Report Inappropriate Content
Re: Adding the user-defined error interval option to the graph builder
Dear Dan,
yes - I would like to get the error bars for each point, correct.
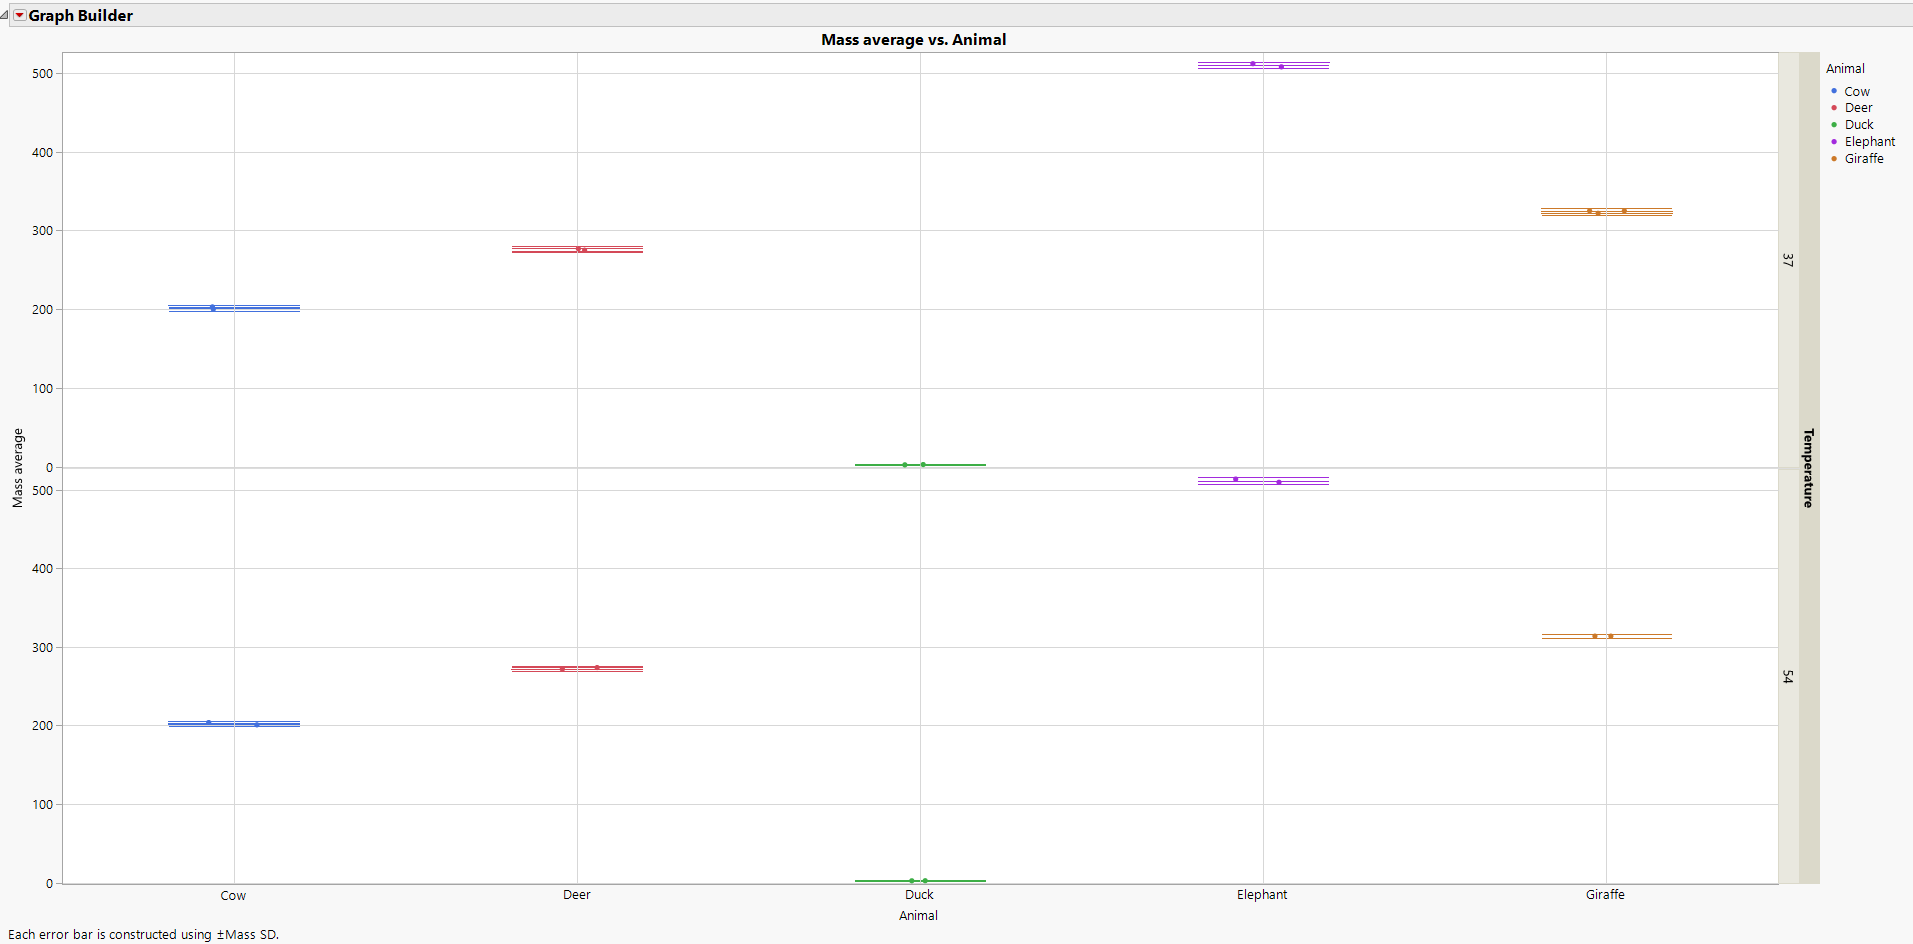
I have created a sample zoo-dataset, where I would like to plot the animal mean weight +/-SD in different temperatures.
And I have SD calculated for each animal in each temperature. That is, I have weighted my elephant three times using the same scales and then calculated the mean and the SD for each animal at each temperature.
Let's agree that SD of a duck kept at 37 C has nothing to do with the SD of the elephant kept in 54 C, because 1. the used scales can be different, 2. days the measurement has been done can also be different and 3. one veterinarian which weighs animals has a better eye to spot things more precisely compared to the other one. So I cannot always agree to use a combined SD from all the means and all temperatures and then put the same one on all experiments in all temperatures and days etc. I know it is easier, but this is incorrect in my particular case. Therefore, I plot SD for each animal independently.
Sorry, the internet was not working yesterday so I could not upload the dataset.
- Mark as New
- Bookmark
- Subscribe
- Mute
- Subscribe to RSS Feed
- Get Direct Link
- Report Inappropriate Content
Re: Adding the user-defined error interval option to the graph builder
Question about your example dataset: Is each row a specific animal? For example, row 1 is a Cow with an average of 200, standard deviation of 3. Was it the same cow measured multiple times? If so, do you have the raw data (that is, each measurement)?
Because you have such a large discrepancy in the means and standard deviations, the graph will always be difficult to read. The ducks around 2.5 with standard deviations around 0.4 are going to look very low and tight since elephants are round 510.
- Mark as New
- Bookmark
- Subscribe
- Mute
- Subscribe to RSS Feed
- Get Direct Link
- Report Inappropriate Content
Re: Adding the user-defined error interval option to the graph builder
My idea is that the cow with the ID 1 has been measured 3 times at 37C and this is how I got the mass and SD from it.
And then experiment ID 2 is another cow, but measured at 54C in the same triplicate way.
So these are two independent cows effectively - and I don't want to join their SDs together from 6 measurements.
Because maybe measurements on cow 1 was done by a sloppy technician and on cow 2 by a good technician.
In my original dataset with bacteria the numbers are more alike each other, so I have no Duck-Elephant comparisons.
But still, I don't want to plot a joint mass SD of all samples. I would want to plot them separately.
- Mark as New
- Bookmark
- Subscribe
- Mute
- Subscribe to RSS Feed
- Get Direct Link
- Report Inappropriate Content
Re: Adding the user-defined error interval option to the graph builder
I have added a dataset with raw data. If you were asking this, cows at row 1 and row 11 are also different cows (let us call them A and B). I just plot them together side by side at 37 with their own means and their own SDs. And cows at row 2 and 12 are also different (let us call them C and D). So I have 4 cows in total, two measured in 37 two at 54 - by random technicians in random days, independent samples etc etc.
- Mark as New
- Bookmark
- Subscribe
- Mute
- Subscribe to RSS Feed
- Get Direct Link
- Report Inappropriate Content
Re: Adding the user-defined error interval option to the graph builder
That is what I thought. In order to keep the intervals from being combined, you need to specify the animal ID as part of the graph. Otherwise there is no way for JMP to know that the first cow is different from the second cow. You can create this from the summary table like this:

But you do not need to have the table summarized. From the raw data, I stacked the measurement columns (data table is attached). I then put the mass measurement as the Y and as the interval, animal as the X-axis and Experiment ID as the nested x-axis variable. Because the animals are so different, the scale is too small to see the error bars, so I added a local data filter that would allow me to choose the animal type to see the graph more easily. That is saved as a script on the data table.

Recommended Articles
- © 2026 JMP Statistical Discovery LLC. All Rights Reserved.
- Terms of Use
- Privacy Statement
- Contact Us