- Instantly extract effect sizes, F-ratios, and FDR-adjusted p-values from your models with the Calculate Effects Sizes extension, available now in the JMP Marketplace!
- New to JMP? Join us Sept. 23-24 for the Early User Edition of Discovery Summit, tailor-made for new users. Register now for free!
- Your voice matters! Tell us how you prefer to receive JMP updates, so we can tailor our communication to your needs. Take short survey.
- Subscribe to RSS Feed
- Mark Topic as New
- Mark Topic as Read
- Float this Topic for Current User
- Bookmark
- Subscribe
- Mute
- Printer Friendly Page
Discussions
Solve problems, and share tips and tricks with other JMP users.- JMP User Community
- :
- Discussions
- :
- Stepwise model question

- Mark as New
- Bookmark
- Subscribe
- Mute
- Subscribe to RSS Feed
- Get Direct Link
- Report Inappropriate Content
Stepwise model question
Hello,
Using Arrhythmia.jmp in sample data library. Let's just say I want to predict a persons Height, for example. For predictors, I select 15 other numeric continuous columns. For this question it doesn't seem to matter. In Models, after selecting a Y variable(s) and construct model effects (predictors), I tend to see these numbers behind predictors. For example: Weight-71.7206. For other predictors this number will be different. What Are these numbers? With SLS and other modeling platforms, coefficients are generated. I understand that Stepwise is for model selection not (directly) prediction equation generation, which leaves me wondering their purpose. Is there documentation on this? In the documentation library I didn't seem to find information on this.

- Tags:
- windows
Accepted Solutions

- Mark as New
- Bookmark
- Subscribe
- Mute
- Subscribe to RSS Feed
- Get Direct Link
- Report Inappropriate Content
Re: Stepwise model question
Hi @StarfruitBob,
These numbers are the mean of the corresponding variables, and JMP is only doing a centering (substracting each individual result from a variable by its mean value), in order to avoid collinearity between main effects and interactions or power terms.
If an interaction / product term is created from two variables that are not centered on 0, some amount of collinearity will be induced (with the exact amount depending on various factors). Centering first addresses this potential problem.
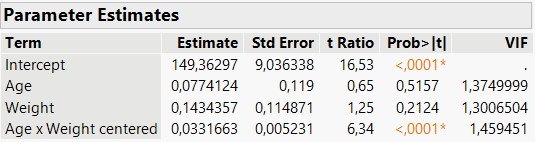
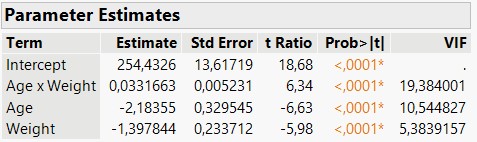
- On this dataset, I created two columns : one with Weight x Age (without centering of the two variable before creating the interaction manually) and one with Weight x Age (with manual centering on the mean of each variables). You can see clearly that centering helps to keep Variable Inflation Factors low.
Some more complete answers can be found here : standardization - When conducting multiple regression, when should you center your predictor variabl...
If you want to see the complete equation of your model, you can click on the red triangle next to "Response [...]", go to "Estimates" and then "Show Prediction Expression". You'll then be able to see on the same report the complete equation, with the centering done on variables for each interaction or power term, and the coefficients for each terms in the model. You can also (in the same red triangle) click on "Save Columns" and then "Prediction Formula". This action will create a new formula column in your datatable, and if you double click on this column and select the column property "Formula", you can also look at the prediction formula.
I hope this response will help you,
"It is not unusual for a well-designed experiment to analyze itself" (Box, Hunter and Hunter)
- Mark as New
- Bookmark
- Subscribe
- Mute
- Subscribe to RSS Feed
- Get Direct Link
- Report Inappropriate Content
Re: Stepwise model question
Hi @StarfruitBob,
These numbers are the mean of the corresponding variables, and JMP is only doing a centering (substracting each individual result from a variable by its mean value), in order to avoid collinearity between main effects and interactions or power terms.
If an interaction / product term is created from two variables that are not centered on 0, some amount of collinearity will be induced (with the exact amount depending on various factors). Centering first addresses this potential problem.
- On this dataset, I created two columns : one with Weight x Age (without centering of the two variable before creating the interaction manually) and one with Weight x Age (with manual centering on the mean of each variables). You can see clearly that centering helps to keep Variable Inflation Factors low.
Some more complete answers can be found here : standardization - When conducting multiple regression, when should you center your predictor variabl...
If you want to see the complete equation of your model, you can click on the red triangle next to "Response [...]", go to "Estimates" and then "Show Prediction Expression". You'll then be able to see on the same report the complete equation, with the centering done on variables for each interaction or power term, and the coefficients for each terms in the model. You can also (in the same red triangle) click on "Save Columns" and then "Prediction Formula". This action will create a new formula column in your datatable, and if you double click on this column and select the column property "Formula", you can also look at the prediction formula.
I hope this response will help you,
"It is not unusual for a well-designed experiment to analyze itself" (Box, Hunter and Hunter)
Recommended Articles
- © 2026 JMP Statistical Discovery LLC. All Rights Reserved.
- Terms of Use
- Privacy Statement
- Contact Us