Turn on suggestions
Auto-suggest helps you quickly narrow down your search results by suggesting possible matches as you type.
- Don’t miss your chance to experience Discovery Summit Europe at our best available rate! Early bird registration through 31 Oct.
- Graph Builder Toolbar streamlines interactive graphing. Creates shortcuts on Report and GraphBuilder Helpers toolbars. Download and install the extension.
Options
- Subscribe to RSS Feed
- Mark Topic as New
- Mark Topic as Read
- Float this Topic for Current User
- Bookmark
- Subscribe
- Mute
- Printer Friendly Page
Discussions
Solve problems, and share tips and tricks with other JMP users.- User Community
- :
- Discussions
- :
- Re: Standard deviation Bars

Level II
- Mark as New
- Bookmark
- Subscribe
- Mute
- Subscribe to RSS Feed
- Get Direct Link
- Report Inappropriate Content
Standard deviation Bars
Apr 7, 2018 04:44 PM
(23472 views)
Hello,
I would like to plot Y by X continous variables. X represent unit time., and Y is mean signal at each time point in X (please see below). I would like to add standard deviation bars to each point. How can I do it in JMP pro 14?
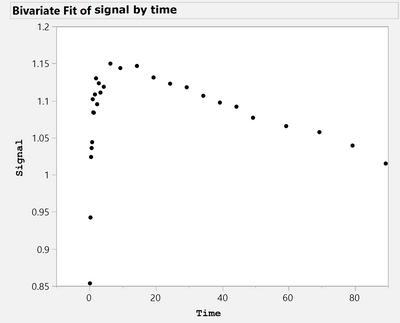
Your help and advices are highly appreciated!
john
John anderson
11 REPLIES 11
Level II
- Mark as New
- Bookmark
- Subscribe
- Mute
- Subscribe to RSS Feed
- Get Direct Link
- Report Inappropriate Content
Re: Standard deviation Bars
Dear txnelson– I highly appreciate your patience on my questions, your expertise and the great help!!
It is worked. Thanks!
John
John anderson

Level IV
- Mark as New
- Bookmark
- Subscribe
- Mute
- Subscribe to RSS Feed
- Get Direct Link
- Report Inappropriate Content
Re: Standard deviation Bars
Hi
great answer, worked for me too!
the only thing u left out is that in order to color the points according to the group variable, you have to drag that variable over to the "color" tab on the right side of the graph builder window
- « Previous
-
- 1
- 2
- Next »
Recommended Articles
- © 2026 JMP Statistical Discovery LLC. All Rights Reserved.
- Terms of Use
- Privacy Statement
- Contact Us