- JMP Statement Regarding Critical PHP Remote Code Execution Vulnerabilities (CVE-2026-109618, CVE-2026-109619)
- Don’t miss your chance to experience Discovery Summit Europe at our best available rate! Early bird registration through 31 Oct.
- Graph Builder Toolbar streamlines interactive graphing. Creates shortcuts on Report and GraphBuilder Helpers toolbars. Download and install the extension.
- Subscribe to RSS Feed
- Mark Topic as New
- Mark Topic as Read
- Float this Topic for Current User
- Bookmark
- Subscribe
- Mute
- Printer Friendly Page
Discussions
Solve problems, and share tips and tricks with other JMP users.- User Community
- :
- Discussions
- :
- Some of the data columns won't appear as box plots in the graph

- Mark as New
- Bookmark
- Subscribe
- Mute
- Subscribe to RSS Feed
- Get Direct Link
- Report Inappropriate Content
Some of the data columns won't appear as box plots in the graph
names Default To Here(1);

MyGraph = Function({yCol, xCol, gpx}, {default local},
    vars = Eval Expr(Variables(
        X(Expr(xCol)),
        Group X(Expr(gpx))
    ));

    pts = Expr(Box Plot(X));

    For(j = 1, j <= Min(8, N Items(yCol)), j++,
        Insert Into(vars, Eval Expr(Y(Expr(yCol[j]))));
    );

    gb = Expr(
        Graph Builder(
            Size(1255, 981),
            Show Control Panel(0),
            // Variables section will be inserted here
            Elements(Box Plot(X, Y(1), Y(2), Y(3), Y(4), Y(5), Y(6), Y(7), Y(8), Legend(11))),
            Local Data Filter(
                Add Filter(
                    columns(:Test Stage, :Sublot, :Temperature, :Soft Bin),
                    Display(:Test Stage, N Items(4)),
                    Display(:Soft Bin, N Items(15))
                )
            )
        )
    );
    Insert Into(gb, Name Expr(vars));

    VListBox(gb)
);
Hi,
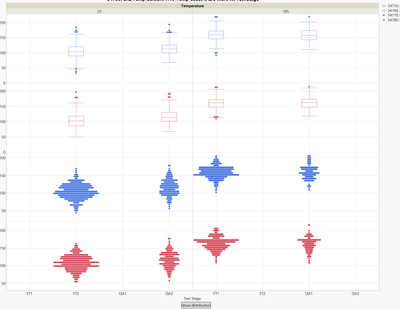
The code attached is not won't plot the Y - data columns as box plots after the 2nd one, and all the box plots wont share the same Y-axis. I want to make sure that the all the columns are plotted as box plots and share the same Y-axis. The code was working fine for plotting points, is plotting box plots different from plotting the points?
Thanks.
Accepted Solutions

- Mark as New
- Bookmark
- Subscribe
- Mute
- Subscribe to RSS Feed
- Get Direct Link
- Report Inappropriate Content
Re: Some of the data columns won't appear as box plots in the graph
the difference between individual subplots and same subplot is explained here:
How to let user choose multiple columns for graph builder
The Trick:
"position(1)" - if you don't specify it to be 1, with every new Y variable position is incremented automatically and the column will be added with a new subplot.

- Mark as New
- Bookmark
- Subscribe
- Mute
- Subscribe to RSS Feed
- Get Direct Link
- Report Inappropriate Content
Re: Some of the data columns won't appear as box plots in the graph
the difference between individual subplots and same subplot is explained here:
How to let user choose multiple columns for graph builder
The Trick:
"position(1)" - if you don't specify it to be 1, with every new Y variable position is incremented automatically and the column will be added with a new subplot.
- Mark as New
- Bookmark
- Subscribe
- Mute
- Subscribe to RSS Feed
- Get Direct Link
- Report Inappropriate Content
Re: Some of the data columns won't appear as box plots in the graph
I see, thanks!
Recommended Articles
- © 2026 JMP Statistical Discovery LLC. All Rights Reserved.
- Terms of Use
- Privacy Statement
- Contact Us