- Don’t miss your chance to experience Discovery Summit Europe at our best available rate! Early bird registration through 31 Oct.
- Image to Table JMP extension imports single or batch images as data tables. Useful to extract curves from pictures or convert image data to curve data to use in analyses like Functional Data Explorer. Download and install the extension.
- Subscribe to RSS Feed
- Mark Topic as New
- Mark Topic as Read
- Float this Topic for Current User
- Bookmark
- Subscribe
- Mute
- Printer Friendly Page
Discussions
Solve problems, and share tips and tricks with other JMP users.- User Community
- :
- Discussions
- :
- Re: Significado de curvas - Grafica de Normalidad

- Mark as New
- Bookmark
- Subscribe
- Mute
- Subscribe to RSS Feed
- Get Direct Link
- Report Inappropriate Content
Significado de curvas - Grafica de Normalidad
Buen dia!
Alguien sabe de donde provienen las lineas curvas rojas que se muestran en la prueba de normalidad y como debo interpretarlas?
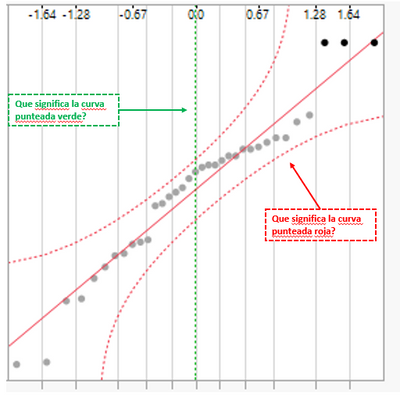
De antemano gracias por el soporte
Saludos,
Angela D
Accepted Solutions


- Mark as New
- Bookmark
- Subscribe
- Mute
- Subscribe to RSS Feed
- Get Direct Link
- Report Inappropriate Content
Re: Significado de curvas - Grafica de Normalidad
When you have your distribution with normal quantile plot, select Help (?) from toolbar and with the ? click on normal quantile plot
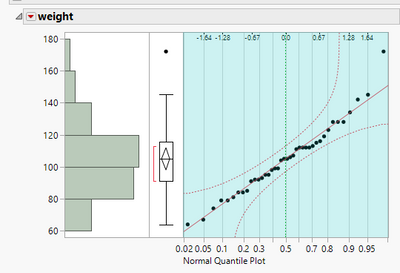
This will bring you to JMP help page which is related to the part of analysis you clicked on top of Basic Analysis > Distributions > Options for Continuous Variables > Normal Quantile Plot
- Mark as New
- Bookmark
- Subscribe
- Mute
- Subscribe to RSS Feed
- Get Direct Link
- Report Inappropriate Content
Re: Significado de curvas - Grafica de Normalidad
When you have your distribution with normal quantile plot, select Help (?) from toolbar and with the ? click on normal quantile plot
This will bring you to JMP help page which is related to the part of analysis you clicked on top of Basic Analysis > Distributions > Options for Continuous Variables > Normal Quantile Plot
Recommended Articles
- © 2026 JMP Statistical Discovery LLC. All Rights Reserved.
- Terms of Use
- Privacy Statement
- Contact Us