- Subscribe to RSS Feed
- Mark Topic as New
- Mark Topic as Read
- Float this Topic for Current User
- Bookmark
- Subscribe
- Mute
- Printer Friendly Page
Discussions
Solve problems, and share tips and tricks with other JMP users.- JMP User Community
- :
- Discussions
- :
- Side by side distribution plots for Tall table
- Mark as New
- Bookmark
- Subscribe
- Mute
- Subscribe to RSS Feed
- Get Direct Link
- Report Inappropriate Content
Side by side distribution plots for Tall table
Hi,
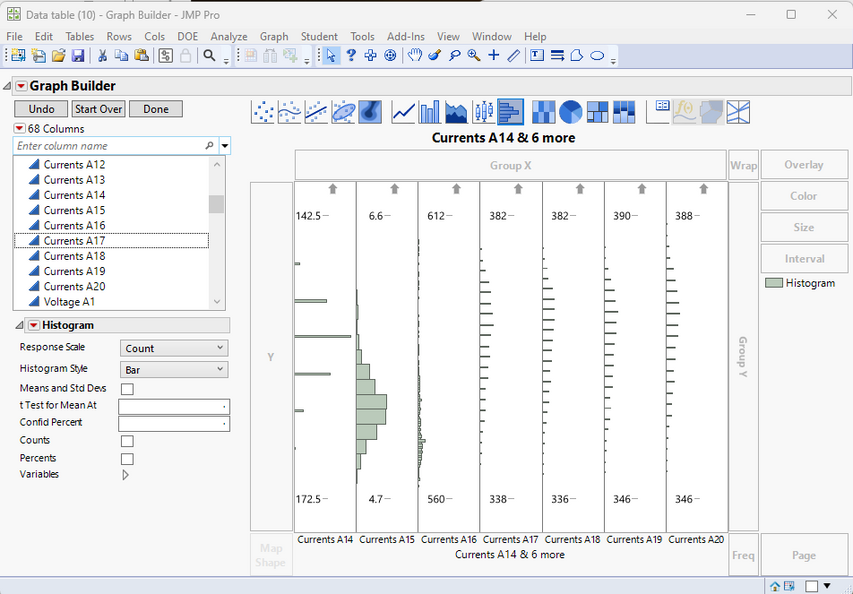
Is it possible to plot side by distribution plots in one graph with tall table? something like Graph Builder?
Something like this?
BR,
Jackie
- Mark as New
- Bookmark
- Subscribe
- Mute
- Subscribe to RSS Feed
- Get Direct Link
- Report Inappropriate Content
Re: Side by side distribution plots
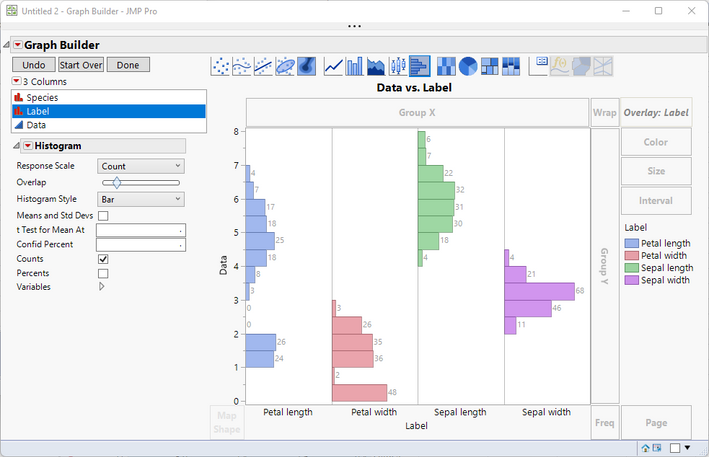
Yes, Graph Builder can do that. I've attached the example below.
- Mark as New
- Bookmark
- Subscribe
- Mute
- Subscribe to RSS Feed
- Get Direct Link
- Report Inappropriate Content
Re: Side by side distribution plots
@Jed_Campbell yes I am aware, but how to plot distribution histogram side by side in the same graph?
- Mark as New
- Bookmark
- Subscribe
- Mute
- Subscribe to RSS Feed
- Get Direct Link
- Report Inappropriate Content
Re: Side by side distribution plots
Sorry, @Jackie_, I must be misunderstanding what you're looking for. Or, perhaps I chose a bad data set with not enough data to make the shape of a histogram. Here's another example of side by side histograms in the Graph Builder. If this isn't what you're looking for, can you please clarify?
- Mark as New
- Bookmark
- Subscribe
- Mute
- Subscribe to RSS Feed
- Get Direct Link
- Report Inappropriate Content
Re: Side by side distribution plots
I think the data table I have is in tall format. So the tests are grouped in columns. Is there a way to plot side by side in graph builder with tall table? I have attached below
- Mark as New
- Bookmark
- Subscribe
- Mute
- Subscribe to RSS Feed
- Get Direct Link
- Report Inappropriate Content
Re: Side by side distribution plots
If you want a histogram for specific columns to be placed side by side, just drag all of them to the X axis and change the display to be a Histogram
- Mark as New
- Bookmark
- Subscribe
- Mute
- Subscribe to RSS Feed
- Get Direct Link
- Report Inappropriate Content
Re: Side by side distribution plots
You can use the Tables...Stack command to change the orientation/format of your data. The attached workflow (assuming you have JMP 17 or greater) walks through how. I also added a local data filter, since the stacked data made the graph have very wide limits otherwise.
- Mark as New
- Bookmark
- Subscribe
- Mute
- Subscribe to RSS Feed
- Get Direct Link
- Report Inappropriate Content
Re: Side by side distribution plots
Thanks @Jed_Campbell , I see you transposed the table. I think this approach works but wondering what if there's tall data table with >1M Rows?. I think transposing into Data columns wouldn't be best.
For ex: I stacked 252k rows and the final data table resulted 56M rows

- Mark as New
- Bookmark
- Subscribe
- Mute
- Subscribe to RSS Feed
- Get Direct Link
- Report Inappropriate Content
Re: Side by side distribution plots
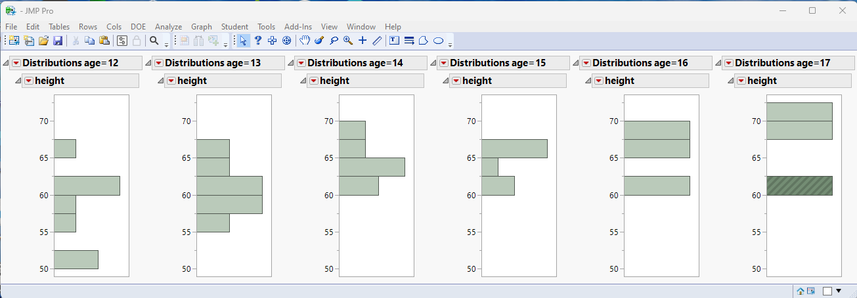
Here is another way to do it
Names Default To Here( 1 );
// Open Data Table: big class.jmp
// → Data Table( "big class" )
Open( "/C:/Program Files/SAS/JMPPRO/16/Samples/Data/big class.jmp" );
nw = New Window( "",
	H List Box(
		Distribution(
			uniform scaling( 1 ),
			Continuous Distribution(
				Column( :height ),
				Quantiles( 0 ),
				Summary Statistics( 0 ),
				Outlier Box Plot( 0 )
			),
			by( :age )
		)
	)
);
- Mark as New
- Bookmark
- Subscribe
- Mute
- Subscribe to RSS Feed
- Get Direct Link
- Report Inappropriate Content
Re: Side by side distribution plots
You can also do this via the Oneway flavor of Fit Y By X:
// Open Data Table: Semiconductor Capability.jmp
// → Data Table( "Semiconductor Capability" )
Open( "$SAMPLE_DATA/Semiconductor Capability.jmp" );

// Report snapshot: Semiconductor Capability - Fit Y by X of NPN1 by lot_id
Data Table( "Semiconductor Capability" ) << Oneway(
	Y( :NPN1 ),
	X( :lot_id ),
	Histograms( 1 )
);Recommended Articles
- © 2026 JMP Statistical Discovery LLC. All Rights Reserved.
- Terms of Use
- Privacy Statement
- Contact Us


