Turn on suggestions
Auto-suggest helps you quickly narrow down your search results by suggesting possible matches as you type.
- Don’t miss your chance to experience Discovery Summit Europe at our best available rate! Early bird registration through 31 Oct.
- Graph Builder Toolbar streamlines interactive graphing. Creates shortcuts on Report and GraphBuilder Helpers toolbars. Download and install the extension.
Options
- Subscribe to RSS Feed
- Mark Topic as New
- Mark Topic as Read
- Float this Topic for Current User
- Bookmark
- Subscribe
- Mute
- Printer Friendly Page
Discussions
Solve problems, and share tips and tricks with other JMP users.- User Community
- :
- Discussions
- :
- Shewhart p-chart for attribute (Sigma)


Super User
- Mark as New
- Bookmark
- Subscribe
- Mute
- Subscribe to RSS Feed
- Get Direct Link
- Report Inappropriate Content
Shewhart p-chart for attribute (Sigma)
Created:
Jan 27, 2023 03:47 AM
| Last Modified: Jun 8, 2023 9:40 AM
(1946 views)
Hi expert,
Is there any way to display the calculated sigma (from binomial distribution) in this limit summaries of p-chart for attribute?
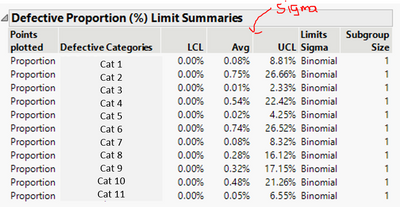
Note: I can calculate it manually by using the formula or reverse mathematical operation but rather than work in Excel, I would like to display it on the JMP limit summaries?
Thanks! (I'm using JMP 15)
1 ACCEPTED SOLUTION
Accepted Solutions

Super User
Solution
- Mark as New
- Bookmark
- Subscribe
- Mute
- Subscribe to RSS Feed
- Get Direct Link
- Report Inappropriate Content
Re: Shewhart p-chart for attribute (Sigma)
If Sigma Report isn't enough, you can use Insert Into to add new Number Col Box to the Limit Summaries table box
Names Default To Here(1);
dt = Open("$SAMPLE_DATA/Probe.jmp");

obj = dt << Control Chart Builder(
	Show Two Shewhart Charts(0),
	Show Sigma Report(1),
	Variables(Y(:DELL_RPNBR), Phase(:Process)),
	Chart(Points(Statistic("Moving Range")), Limits(Sigma("Moving Range"))),
	Show Control Panel(0)
);

tb = Report(obj)["Control Chart Builder","DELL_RPNBR Limit Summaries",TableBox(1)];
// get/calculate sigma values...
sigma_values = [3,4];
Insert Into(tb, Number Col Box("Sigma", sigma_values), 5);
-Jarmo
1 REPLY 1
Super User
Solution
- Mark as New
- Bookmark
- Subscribe
- Mute
- Subscribe to RSS Feed
- Get Direct Link
- Report Inappropriate Content
Re: Shewhart p-chart for attribute (Sigma)
If Sigma Report isn't enough, you can use Insert Into to add new Number Col Box to the Limit Summaries table box
Names Default To Here(1);
dt = Open("$SAMPLE_DATA/Probe.jmp");

obj = dt << Control Chart Builder(
	Show Two Shewhart Charts(0),
	Show Sigma Report(1),
	Variables(Y(:DELL_RPNBR), Phase(:Process)),
	Chart(Points(Statistic("Moving Range")), Limits(Sigma("Moving Range"))),
	Show Control Panel(0)
);

tb = Report(obj)["Control Chart Builder","DELL_RPNBR Limit Summaries",TableBox(1)];
// get/calculate sigma values...
sigma_values = [3,4];
Insert Into(tb, Number Col Box("Sigma", sigma_values), 5);
-Jarmo
Recommended Articles
- © 2026 JMP Statistical Discovery LLC. All Rights Reserved.
- Terms of Use
- Privacy Statement
- Contact Us