- JMP will suspend normal business operations for our Winter Holiday beginning on Wednesday, Dec. 24, 2025, at 5:00 p.m. ET (2:00 p.m. ET for JMP Accounts Receivable).
Regular business hours will resume at 9:00 a.m. EST on Friday, Jan. 2, 2026. - We’re retiring the File Exchange at the end of this year. The JMP Marketplace is now your destination for add-ins and extensions.
- Subscribe to RSS Feed
- Mark Topic as New
- Mark Topic as Read
- Float this Topic for Current User
- Bookmark
- Subscribe
- Mute
- Printer Friendly Page
Discussions
Solve problems, and share tips and tricks with other JMP users.- JMP User Community
- :
- Discussions
- :
- Re: Scripting to run multiple analyses
- Mark as New
- Bookmark
- Subscribe
- Mute
- Subscribe to RSS Feed
- Get Direct Link
- Report Inappropriate Content
Scripting to run multiple analyses
Is it possible to write scripts in JMP for running multiple analyses? Many analysis in JMP only allow one response (one input). In the case of hundreds of responses, it needs too much clicking. What are the steps to start a script?
Thanks!
- Mark as New
- Bookmark
- Subscribe
- Mute
- Subscribe to RSS Feed
- Get Direct Link
- Report Inappropriate Content
Re: Scripting to run multiple analyses
I am surprised by your comment. Most platforms in JMP allow for an unlimited number of responses. I am interested in which platforms you only see a single response defined. GRaph Builder???
The easiest way to get a script started, is to run the platform interactively for one of the response columns, and then from the red triangle in the output display, select Save Script=>Script Window. There you will see the script required to produce the output.
Also, in JMP 16, you can run your multiple steps interactively, and then go to the log and retrieve the scripts required to perform the steps you ran.
- Mark as New
- Bookmark
- Subscribe
- Mute
- Subscribe to RSS Feed
- Get Direct Link
- Report Inappropriate Content
Re: Scripting to run multiple analyses
Hi, i am just a beginner using JMP, still getting familiar with it. See pics attached. These are the ones I meant. But I think I know now how to do scripts in JMP.
- Mark as New
- Bookmark
- Subscribe
- Mute
- Subscribe to RSS Feed
- Get Direct Link
- Report Inappropriate Content
Re: Scripting to run multiple analyses
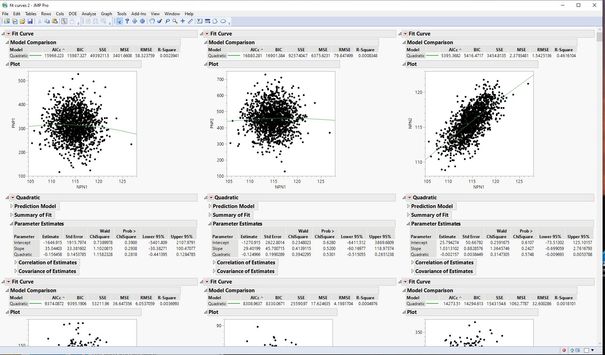
Ah......yes the examples you attached are examples of single response variable analyses. Below, is an example of taking 1 of your examples, Fit Curve, and generating 127 analyses, each with a different response variable
Here is the simple script that produced the above output
Names Default To Here( 1 );
dt = Open( "$sample_data/semiconductor capability.jmp" );

colList = dt << get column names( continuous );
nw = New Window( "fit curves", lub = Lineup Box( N Col( 3 ) ) );
For( i = 2, i <= N Items( colList ), i++,
	lub << append( Fit Curve( Y( Column( Char( colList[i] ) ) ), X( :npn1 ), Fit Quadratic ) )
);
- Mark as New
- Bookmark
- Subscribe
- Mute
- Subscribe to RSS Feed
- Get Direct Link
- Report Inappropriate Content
Re: Scripting to run multiple analyses
Cool! Thanks!
- Mark as New
- Bookmark
- Subscribe
- Mute
- Subscribe to RSS Feed
- Get Direct Link
- Report Inappropriate Content
Re: Scripting to run multiple analyses
Check out the Column Switcher. It will let you examine multiple columns without scripting.
The documentation will walk you through an example.
Recommended Articles
- © 2025 JMP Statistical Discovery LLC. All Rights Reserved.
- Terms of Use
- Privacy Statement
- Contact Us


