- New to JMP? Join us Sept. 23-24 for the Early User Edition of Discovery Summit, tailor-made for new users. Register now for free!
- Use World Cup data to build models, explore spatial relationships, and create informative visualizations in JMP. Register. July 17, 2 pm US Eastern Time.
- Your voice matters! Tell us how you prefer to receive JMP updates, so we can tailor our communication to your needs. Take short survey.
- Subscribe to RSS Feed
- Mark Topic as New
- Mark Topic as Read
- Float this Topic for Current User
- Bookmark
- Subscribe
- Mute
- Printer Friendly Page
Discussions
Solve problems, and share tips and tricks with other JMP users.- JMP User Community
- :
- Discussions
- :
- Scripting a Gauge R&R issue

- Mark as New
- Bookmark
- Subscribe
- Mute
- Subscribe to RSS Feed
- Get Direct Link
- Report Inappropriate Content
Scripting a Gauge R&R issue
as below JMP script is for Gauge R&R 5 sigma
but in my Variability Chart ,I always got one first item can set up successfully on Gauge RR 5 sigma.
i don;t understand, why i can;t get all of "y list " item on 5 sigma.
anyone can help me?
rezults = Column Dialog(
title( "Select Columns For Gauge R&R Analysis" ),
yycol = ColList( "Y, Response", Mincol( 1 ), DataType( Numeric ) ),
xxcol = ColList( "X, Factor", Mincol( 1 ), Modeling Type( Nominal ) ),
bbycol = ColList( "By" )
);
ylist = rezults["yycol"];
xlist = rezults["xxcol"];
bbylist = rezults["bbycol"];
N = N Items( ylist );
For( i = 1, i <= N, i++,
s = dt << Get Property( "Spec Limits" );
usl = s["USL"];
lsl = s["LSL"];
);
obj = Variability Chart(
Y( Eval( ylist ) ),
X( Eval( xlist ) ),
By( Eval( bbylist ) ),
Model( "Main Effect" ),
Max Iter( 100 ),
Conv Limit( 0.00000001 ),
Number Integration Abscissas( 128 ),
Number Function Evals( 65536 ),
Analysis Type( "Choose best analysis (EMS REML)" ),
Historical Mean( 0 ),
Historical Sigma( 0 ),
//Process Variation( 0 ),
Std Dev Chart( 0 ),
);
obj << Gauge RR( 5, usl - lsl, lsl, usl );
Accepted Solutions

- Mark as New
- Bookmark
- Subscribe
- Mute
- Subscribe to RSS Feed
- Get Direct Link
- Report Inappropriate Content
Re: Scripting a Gauge R&R issue
Ignore the original version of this reply. I'm going to go with the 'it was before my morning coffee excuse'.
Try this. A couple corrections. The s, lsl, usl were not stored in a list in previous posts so the values were stale. fixed here. I inadvertantly used the "N" as the iterating parameter instead of i. Fixed here. Definitely double check this is doing what you want.
//clear log();
namespace("here")<<remove(namespace("here")<<getkeys);
names default to here(1);
dt = current data table();

showErrorMsg = expr(New Window("Must select at least one column...",<<Modal, textBox("Must select at least one column in Y and X roles.               "),
ButtonBox("OK")));

//grrFunction = Function({ylist, xlist, bbylist},    // pass GUI variables to locals here, downside is can't hover to observe values
grrFunction = Function({x}, // x not used here, just using the variables from the GUI and re-assinging to existing vars

    ylist = yParamNames;
    xlist = xParamNames;
    bbylist = byParamNames;

    N = N Items( ylist );

    nwOutput = new window("Output",
        vlb_out = vlistbox();
    );
    For( i = 1, i <= N, i++,
        s = column(dt, ylist[i]) << Get Property( "Spec Limits" );    // note that I had a typo here, should be i, not N
        usl = s["USL"];
        lsl = s["LSL"];

        //obj = Variability Chart(
        vlb_out << append(
            Variability Chart(
                Y( Eval( ylist[i] ) ),
                X( Eval( xlist ) ),
                By( Eval( bbylist ) ),
                Model( "Main Effect" ),
                Max Iter( 100 ),
                Conv Limit( 0.00000001 ),
                Number Integration Abscissas( 128 ),
                Number Function Evals( 65536 ),
                Analysis Type( "Choose best analysis (EMS REML)" ),
                Historical Mean( 0 ),
                Historical Sigma( 0 ),
            //Process Variation( 0 ),
                Std Dev Chart( 0 ),
                 Gauge RR( 5, usl - lsl, lsl, usl );
            )//;
        )
    );
//    obj << Gauge RR( 5, usl - lsl, lsl, usl );

);

nw = new window("Select Columns For Gauge R&R Analysis",
    hlistbox( // horizontal list box
        cflObj = filter col selector(data table(dt << get name()), nlines(20)),    //first item in hlist box

        panelbox( "Cast selected columns into roles",                        // second item
            lineupbox(ncol(2),
                    bb_y = buttonbox("Y, Response",
                        newParams = cflObj << get selected;
                        yColObj << append(newParams);
                    ),
                    yColObj = col list box(data table(dt << get name()),numeric,nlines(5), min items(1)),

                    bb_x = buttonbox("X, Factor",
                        newParams = cflObj << get selected;
                        xColObj << append(newParams);
                    ),
                    xColObj = col list box(data table(dt << get name()),nlines(3), min items(1), <<Set Analysis Type(Nominal)),

                    bb_by = buttonbox("By",
                        newParams = cflObj << get selected;
                        byColObj << append(newParams);
                    ),
                    byColObj = col list box(data table(dt << get name()),nlines(3))
            )// end lineupbox
        )// end roles panel box
        ,
        panelbox("Actions",                                                    // final item
            vlistbox(
                button box("Ok",
                        yParamNames = yColObj << get items;
                        xParamNames = xColObj << get items;
                        byParamNames = byColObj << get items;

                        if ( nitems(yParamNames) == 0 | nitems(xParamNames) == 0  ,
                            showErrorMsg
                        ,
                            //else
                            new namespace("recall_grr");
                            recall_grr:yParamNames_rcl = yColObj << get items;
                            recall_grr:xParamNames_rcl = xColObj << get items;
                            recall_grr:byParamNames_rcl = byColObj << get items;
                            nw << close window;
                            //grrFunction(yParamNames, xParamNames, byParamNames)        //pass to local
                            grrFunction(1)        // use these 3 (above) vars directly without passing
                        );

                ),
                button box("Remove", yColObj << remove selected; xColObj << remove selected; byColObj << remove selected),
                button box("Cancel", nw << close window),
                spacerbox(Size(1,80)),
                button box("Recall",
                    try(yColObj << append(recall_grr:yParamNames_rcl));
                    try(xColObj << append(recall_grr:xParamNames_rcl));
                    try(byColObj << append(recall_grr:byParamNames_rcl));

                )
            )
        )//end actions panel box
    ) // end hlistbox
);//end new window nw
- Mark as New
- Bookmark
- Subscribe
- Mute
- Subscribe to RSS Feed
- Get Direct Link
- Report Inappropriate Content
Re: Scripting a Gauge R&R issue
You didn't have dt defined but I assume you had it defined separately. But even so, you were using this command in the loop:
s = dt << Get Property( "Spec Limits" );This doesn't work (assuming dt is a data table) because the spec limits are a property of a column, not the data table. See below for how to reference the column and access the spec limits property. I've added a dt = current data table() line.
Also, the column dialog() command is deprecated (I think) and replaced by the new window() command which uses a whole host of display boxes including "filter col selector()", "col list box()", and "button box()". If you're just starting out you might consider switching. Up to you, but just consider switching vs creating lots of scripts with deprecated features.
dt = current data table();

rezults = Column Dialog(
	title( "Select Columns For Gauge R&R Analysis" ),
	yycol = ColList( "Y, Response", Mincol( 1 ), DataType( Numeric ) ),
	xxcol = ColList( "X, Factor", Mincol( 1 ), Modeling Type( Nominal ) ),
	bbycol = ColList( "By" )
);
ylist = rezults["yycol"];
xlist = rezults["xxcol"];
bbylist = rezults["bbycol"];
N = N Items( ylist );
For( i = 1, i <= N, i++,
	s = column(dt, ylist[N]) << Get Property( "Spec Limits" );
	usl = s["USL"];
	lsl = s["LSL"];
);
obj = Variability Chart(
	Y( Eval( ylist ) ),
	X( Eval( xlist ) ),
	By( Eval( bbylist ) ),
	Model( "Main Effect" ),
	Max Iter( 100 ),
	Conv Limit( 0.00000001 ),
	Number Integration Abscissas( 128 ),
	Number Function Evals( 65536 ),
	Analysis Type( "Choose best analysis (EMS REML)" ),
	Historical Mean( 0 ),
	Historical Sigma( 0 ),
//Process Variation( 0 ),
	Std Dev Chart( 0 ),

);
obj << Gauge RR( 5, usl - lsl, lsl, usl );
- Mark as New
- Bookmark
- Subscribe
- Mute
- Subscribe to RSS Feed
- Get Direct Link
- Report Inappropriate Content
Re: Scripting a Gauge R&R issue
Here's the re-write. If for no other reason the recall feature makes things easier to debug.
Edit: Don't use this version. There are issues with the s, lsl, and usl variables being stale and it also doesn't address the OP's issue.
//clear log();
namespace("here")<<remove(namespace("here")<<getkeys);
names default to here(1);
dt = current data table();

showErrorMsg = expr(New Window("Must select at least one column...",<<Modal, textBox("Must select at least one column in Y and X roles.               "),
ButtonBox("OK")));

//grrFunction = Function({ylist, xlist, bbylist},	// pass GUI variables to locals here, downside is can't hover to observe values
grrFunction = Function({x}, // x not used here, just using the variables from the GUI and re-assinging to existing vars

	ylist = yParamNames;
	xlist = xParamNames;
	bbylist = byParamNames;

	N = N Items( ylist );
	For( i = 1, i <= N, i++,
		s = column(dt, ylist[i]) << Get Property( "Spec Limits" );
		usl = s["USL"];
		lsl = s["LSL"];
	);
	obj = Variability Chart(
		Y( Eval( ylist ) ),
		X( Eval( xlist ) ),
		By( Eval( bbylist ) ),
		Model( "Main Effect" ),
		Max Iter( 100 ),
		Conv Limit( 0.00000001 ),
		Number Integration Abscissas( 128 ),
		Number Function Evals( 65536 ),
		Analysis Type( "Choose best analysis (EMS REML)" ),
		Historical Mean( 0 ),
		Historical Sigma( 0 ),
	//Process Variation( 0 ),
		Std Dev Chart( 0 ),
	);
	obj << Gauge RR( 5, usl - lsl, lsl, usl );

);

nw = new window("Select Columns For Gauge R&R Analysis",
	hlistbox( // horizontal list box
		cflObj = filter col selector(data table(dt << get name()), nlines(20)),	//first item in hlist box

		panelbox( "Cast selected columns into roles",						// second item
			lineupbox(ncol(2),
					bb_y = buttonbox("Y, Response",
						newParams = cflObj << get selected;
						yColObj << append(newParams);
					),
					yColObj = col list box(data table(dt << get name()),numeric,nlines(5), min items(1)),

					bb_x = buttonbox("X, Factor",
						newParams = cflObj << get selected;
						xColObj << append(newParams);
					),
					xColObj = col list box(data table(dt << get name()),nlines(3), min items(1), <<Set Analysis Type(Nominal)),

					bb_by = buttonbox("By",
						newParams = cflObj << get selected;
						byColObj << append(newParams);
					),
					byColObj = col list box(data table(dt << get name()),nlines(3))
			)// end lineupbox
		)// end roles panel box
		,
		panelbox("Actions",													// final item
			vlistbox(
				button box("Ok",
						yParamNames = yColObj << get items;
						xParamNames = xColObj << get items;
						byParamNames = byColObj << get items;

						if ( nitems(yParamNames) == 0 | nitems(xParamNames) == 0  ,
							showErrorMsg
						,
							//else
							new namespace("recall_grr");
							recall_grr:yParamNames_rcl = yColObj << get items;
							recall_grr:xParamNames_rcl = xColObj << get items;
							recall_grr:byParamNames_rcl = byColObj << get items;
							nw << close window;
							//grrFunction(yParamNames, xParamNames, byParamNames)		//pass to local
							grrFunction(1)		// use these 3 (above) vars directly without passing
						);

				),
				button box("Remove", yColObj << remove selected; xColObj << remove selected; byColObj << remove selected),
				button box("Cancel", nw << close window),
				spacerbox(Size(1,80)),
				button box("Recall",
					try(yColObj << append(recall_grr:yParamNames_rcl));
					try(xColObj << append(recall_grr:xParamNames_rcl));
					try(byColObj << append(recall_grr:byParamNames_rcl));

				)
			)
		)//end actions panel box
	) // end hlistbox
);//end new window nw
- Mark as New
- Bookmark
- Subscribe
- Mute
- Subscribe to RSS Feed
- Get Direct Link
- Report Inappropriate Content
Re: Scripting a Gauge R&R issue
thanks for your reply,
but I still meet issue in here
after I ran script then i got variablity Gauge chart then
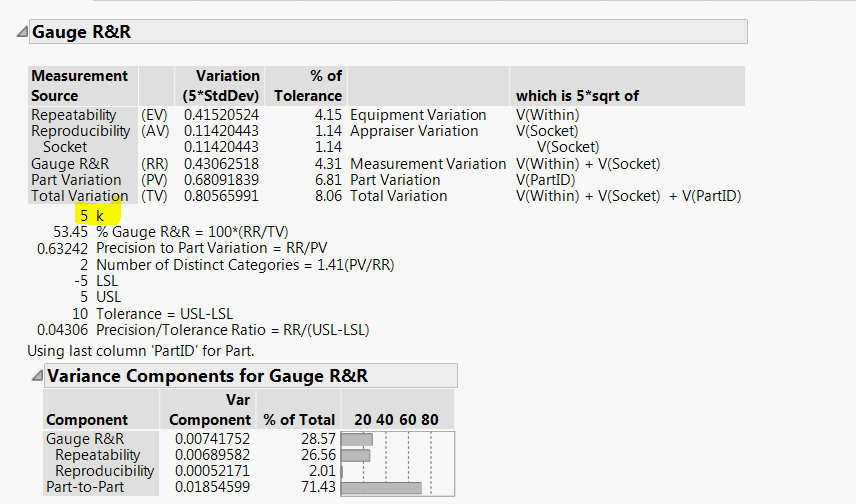
1 st item on Gauge R&R = > can show 5K in VC chart. it is correct
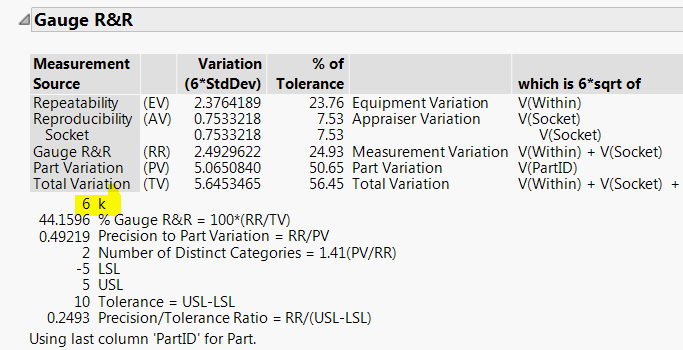
but 2nd item on Gauge R&R result => it is showing "6K" in VC chart.
i wnat all of ylist item be caluate 5K in Guage R&R
@mikedriscoll Do you have any better idea in here?
- Mark as New
- Bookmark
- Subscribe
- Mute
- Subscribe to RSS Feed
- Get Direct Link
- Report Inappropriate Content
Re: Scripting a Gauge R&R issue
Ignore the original version of this reply. I'm going to go with the 'it was before my morning coffee excuse'.
Try this. A couple corrections. The s, lsl, usl were not stored in a list in previous posts so the values were stale. fixed here. I inadvertantly used the "N" as the iterating parameter instead of i. Fixed here. Definitely double check this is doing what you want.
//clear log();
namespace("here")<<remove(namespace("here")<<getkeys);
names default to here(1);
dt = current data table();

showErrorMsg = expr(New Window("Must select at least one column...",<<Modal, textBox("Must select at least one column in Y and X roles.               "),
ButtonBox("OK")));

//grrFunction = Function({ylist, xlist, bbylist},    // pass GUI variables to locals here, downside is can't hover to observe values
grrFunction = Function({x}, // x not used here, just using the variables from the GUI and re-assinging to existing vars

    ylist = yParamNames;
    xlist = xParamNames;
    bbylist = byParamNames;

    N = N Items( ylist );

    nwOutput = new window("Output",
        vlb_out = vlistbox();
    );
    For( i = 1, i <= N, i++,
        s = column(dt, ylist[i]) << Get Property( "Spec Limits" );    // note that I had a typo here, should be i, not N
        usl = s["USL"];
        lsl = s["LSL"];

        //obj = Variability Chart(
        vlb_out << append(
            Variability Chart(
                Y( Eval( ylist[i] ) ),
                X( Eval( xlist ) ),
                By( Eval( bbylist ) ),
                Model( "Main Effect" ),
                Max Iter( 100 ),
                Conv Limit( 0.00000001 ),
                Number Integration Abscissas( 128 ),
                Number Function Evals( 65536 ),
                Analysis Type( "Choose best analysis (EMS REML)" ),
                Historical Mean( 0 ),
                Historical Sigma( 0 ),
            //Process Variation( 0 ),
                Std Dev Chart( 0 ),
                 Gauge RR( 5, usl - lsl, lsl, usl );
            )//;
        )
    );
//    obj << Gauge RR( 5, usl - lsl, lsl, usl );

);

nw = new window("Select Columns For Gauge R&R Analysis",
    hlistbox( // horizontal list box
        cflObj = filter col selector(data table(dt << get name()), nlines(20)),    //first item in hlist box

        panelbox( "Cast selected columns into roles",                        // second item
            lineupbox(ncol(2),
                    bb_y = buttonbox("Y, Response",
                        newParams = cflObj << get selected;
                        yColObj << append(newParams);
                    ),
                    yColObj = col list box(data table(dt << get name()),numeric,nlines(5), min items(1)),

                    bb_x = buttonbox("X, Factor",
                        newParams = cflObj << get selected;
                        xColObj << append(newParams);
                    ),
                    xColObj = col list box(data table(dt << get name()),nlines(3), min items(1), <<Set Analysis Type(Nominal)),

                    bb_by = buttonbox("By",
                        newParams = cflObj << get selected;
                        byColObj << append(newParams);
                    ),
                    byColObj = col list box(data table(dt << get name()),nlines(3))
            )// end lineupbox
        )// end roles panel box
        ,
        panelbox("Actions",                                                    // final item
            vlistbox(
                button box("Ok",
                        yParamNames = yColObj << get items;
                        xParamNames = xColObj << get items;
                        byParamNames = byColObj << get items;

                        if ( nitems(yParamNames) == 0 | nitems(xParamNames) == 0  ,
                            showErrorMsg
                        ,
                            //else
                            new namespace("recall_grr");
                            recall_grr:yParamNames_rcl = yColObj << get items;
                            recall_grr:xParamNames_rcl = xColObj << get items;
                            recall_grr:byParamNames_rcl = byColObj << get items;
                            nw << close window;
                            //grrFunction(yParamNames, xParamNames, byParamNames)        //pass to local
                            grrFunction(1)        // use these 3 (above) vars directly without passing
                        );

                ),
                button box("Remove", yColObj << remove selected; xColObj << remove selected; byColObj << remove selected),
                button box("Cancel", nw << close window),
                spacerbox(Size(1,80)),
                button box("Recall",
                    try(yColObj << append(recall_grr:yParamNames_rcl));
                    try(xColObj << append(recall_grr:xParamNames_rcl));
                    try(byColObj << append(recall_grr:byParamNames_rcl));

                )
            )
        )//end actions panel box
    ) // end hlistbox
);//end new window nw
- Mark as New
- Bookmark
- Subscribe
- Mute
- Subscribe to RSS Feed
- Get Direct Link
- Report Inappropriate Content
Re: Scripting a Gauge R&R issue
thanks for your sharing.
Recommended Articles
- © 2026 JMP Statistical Discovery LLC. All Rights Reserved.
- Terms of Use
- Privacy Statement
- Contact Us