cancel
Showing results for 
Show  only  | Search instead for 
Did you mean: 
  • Image to Table JMP extension imports single or batch images as data tables. Useful to extract curves from pictures or convert image data to curve data to use in analyses like Functional Data Explorer. Download and install the extension.

Discussions

Solve problems, and share tips and tricks with other JMP users.
Choose Language Hide Translation Bar
yanee
Level III

Save distribution to power point

Hi


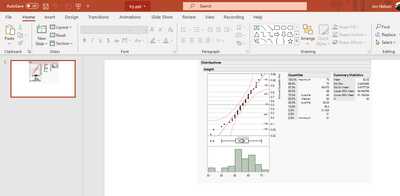
I try to save distribution plot into the .pptx. it does save however, it come into 3 pages for each plot ( pg 1 distribution, pg 2 quantiles, pg 3 summary statistics).

is there a way to combine all that into 1 pages ?


names default to here (1);
dt = current data table();

plot = 
Distribution(
	Stack( 1 ),
	Continuous Distribution(
		Column( :Q1'22 POR Fcst $ ),
		Horizontal Layout( 1 ),
		Vertical( 0 ),
		Normal Quantile Plot( 1 )
	)
);

plot << save presentation ("C:\temp\try.ppt");

 

1 REPLY 1
txnelson
Super User

Re: Save distribution to power point

You need to move all objects into a single image and then save it.  Here is an example

txnelson_0-1627929282627.png


\Names Default To Here( 1 );
dt = Open( "$sample_data/big class.jmp" );

plot = Distribution(
	Stack( 1 ),
	Continuous Distribution( Column( :height ), Horizontal Layout( 1 ), Vertical( 0 ), Normal Quantile Plot( 1 ) )
);

nw = New Window( "Output", (Report( plot )[Outline Box( 1 )] << get picture) );

nw << save presentation( "$TEMP\try.ppt" );

Open( "$TEMP\try.ppt" );


Jim

Recommended Articles