- New to JMP? Join us Sept. 23-24 for the Early User Edition of Discovery Summit, tailor-made for new users. Register now for free!
- Your voice matters! Tell us how you prefer to receive JMP updates, so we can tailor our communication to your needs. Take short survey.
- See how to access JMP Marketplace - and - find, create & share add-ins to extend your JMP. Watch video.
- Subscribe to RSS Feed
- Mark Topic as New
- Mark Topic as Read
- Float this Topic for Current User
- Bookmark
- Subscribe
- Mute
- Printer Friendly Page
Discussions
Solve problems, and share tips and tricks with other JMP users.- JMP User Community
- :
- Discussions
- :
- Response surface mesh and 3D contour plot

- Mark as New
- Bookmark
- Subscribe
- Mute
- Subscribe to RSS Feed
- Get Direct Link
- Report Inappropriate Content
Response surface mesh and 3D contour plot
Hello,
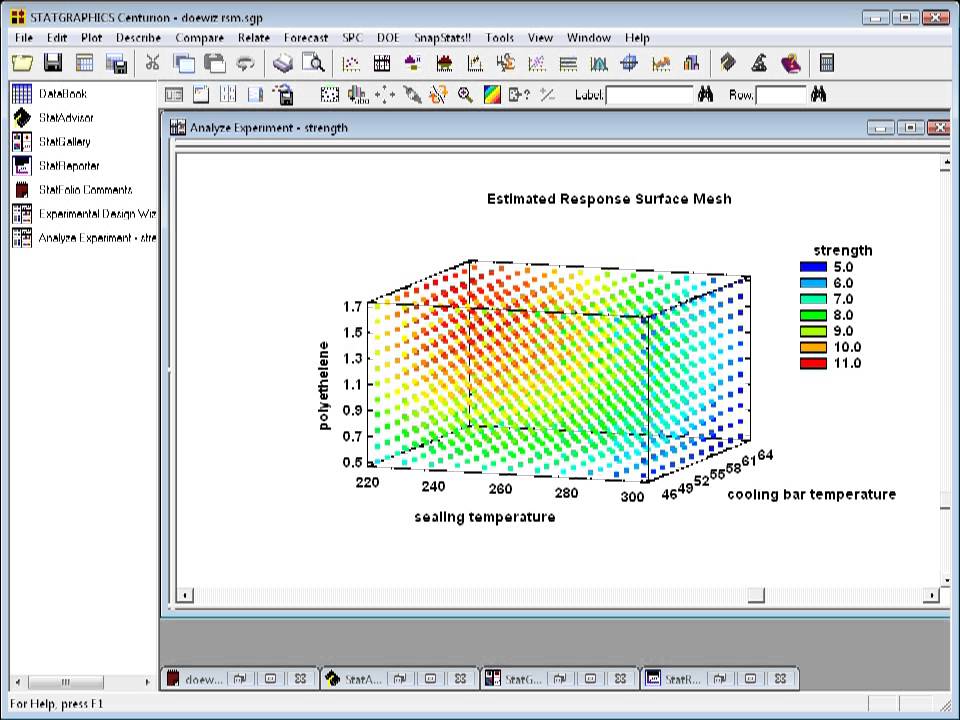
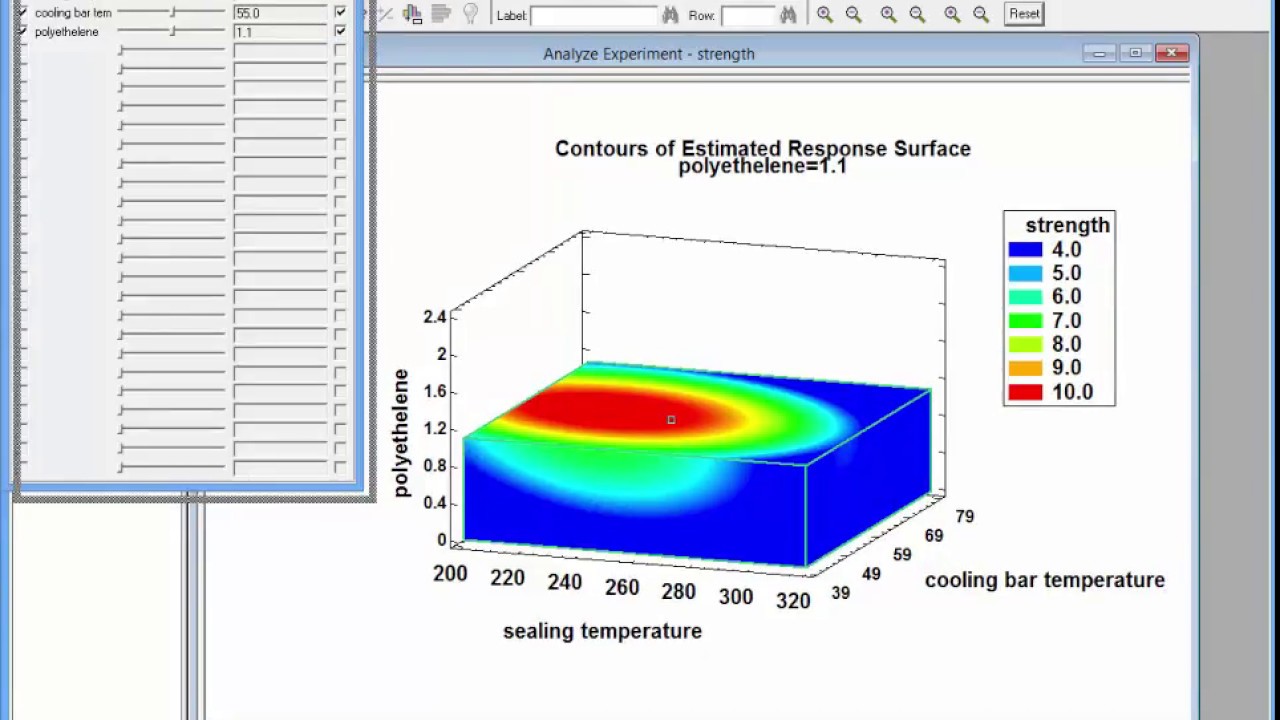
does anybody know, if it is possible to create a Response surface mesh and 3D contoour plot in JMP. If it is, how can I do that? I added two pictures, to better ilustrate what I have in mind.
Response surface mesh
3D contour plot
Is there any better way to present a response which is dependent on three factors in one plot? I first presented the relation with 9 surface plots (3 for every combination of 2 factors, the third factor has always a different value (-1,0,1)), which is a very clear presentation in my opinion but it takes a lot of space and can hide the general picture because it is too segmented. I was also thinking about cube plot, but it hides a lot of information, especially, because I have one quadratic effect...
Thank you in advance,
Danijel

- Mark as New
- Bookmark
- Subscribe
- Mute
- Subscribe to RSS Feed
- Get Direct Link
- Report Inappropriate Content
Re: Response surface mesh and 3D contour plot
You will find a lot of information about the JMP versions by selecting Help > Books > Profilers.
I should add that these profilers are available in most fitting platforms and separately as their own stand alone platform. In the latter case, they use a column formula. You can save fitted models as a column formula.

- Mark as New
- Bookmark
- Subscribe
- Mute
- Subscribe to RSS Feed
- Get Direct Link
- Report Inappropriate Content
Re: Response surface mesh and 3D contour plot
Oh, when I have a function that has many factors, I like parallel plots. Some say it is an "acquired taste." For your example, I think the multi-view (as I explained above) would be more informative for most.
- Mark as New
- Bookmark
- Subscribe
- Mute
- Subscribe to RSS Feed
- Get Direct Link
- Report Inappropriate Content
Re: Response surface mesh and 3D contour plot
I have attached an example script of the JMP 3D profiler with Mesh.
JMP has a 3D scatterplot and a Surface Profiler.
It is not too difficult with a little scripting to create a 9 plot view, or use Graph Builder: use 2 factors one for X and one for Y, making sure the one with the quadratic effect is included, then create if the other 2 factors can have discrete values like -1, 0 and 1, use one factor for X grouping and another for Y grouping then color by the modeled strength. Then instead of points use a contour.
Another possibility is to create "pictures" of the 3D plots the multiple levels of the remaining factors. and store then in a table. JMP 14 allows pictures to be used as the graphic icons, so you could create a grid of 3D views.
If your model has a secondary relationship, where the model can be reparameterized (for example maybe a combination of sealing and cooling temperature), you might be able to use it to reduce the dimensionality. However, from my experience, these are more difficult to visualize.
- Mark as New
- Bookmark
- Subscribe
- Mute
- Subscribe to RSS Feed
- Get Direct Link
- Report Inappropriate Content
Re: Response surface mesh and 3D contour plot
Thank you for elaborate answer. I think I will stay with 9 response surface graphs.
I still didn't get the answer for my first question though. I already know the 3D profiler, but I actualy want to make it 4D. I want that values of factors to determine the location of points (like 3D coordinates) and that I then colour the points, where the colour of the points represents the response (for example red for high values, blue for low). Than I would do a contour instead of points. Is there any way to colout the points in the way I described?

- Mark as New
- Bookmark
- Subscribe
- Mute
- Subscribe to RSS Feed
- Get Direct Link
- Report Inappropriate Content
Re: Response surface mesh and 3D contour plot
Hi,
Did you end up getting an answer for this? I'm in the same boat trying to make the graphic 4D to represent a color contour.
- Mark as New
- Bookmark
- Subscribe
- Mute
- Subscribe to RSS Feed
- Get Direct Link
- Report Inappropriate Content
Re: Response surface mesh and 3D contour plot
Hi,
unfortunately no, however, when you think about it there is a reason that JMP or other statistical softwares doesn't offer possibility to create 4D plot, since it is a very unclear presentation. My advice would be to stick to 2D charts when possible, since we are ussually presenting charts on 2D surface, when neccessary use 3D.
Recommended Articles
- © 2026 JMP Statistical Discovery LLC. All Rights Reserved.
- Terms of Use
- Privacy Statement
- Contact Us