- Instantly extract effect sizes, F-ratios, and FDR-adjusted p-values from your models with the Calculate Effects Sizes extension, available now in the JMP Marketplace!
- New to JMP? Join us Sept. 23-24 for the Early User Edition of Discovery Summit, tailor-made for new users. Register now for free!
- Your voice matters! Tell us how you prefer to receive JMP updates, so we can tailor our communication to your needs. Take short survey.
- Subscribe to RSS Feed
- Mark Topic as New
- Mark Topic as Read
- Float this Topic for Current User
- Bookmark
- Subscribe
- Mute
- Printer Friendly Page
Discussions
Solve problems, and share tips and tricks with other JMP users.- JMP User Community
- :
- Discussions
- :
- Residual by Predicted Plot question_same data generate different plot with Fit Y...

- Mark as New
- Bookmark
- Subscribe
- Mute
- Subscribe to RSS Feed
- Get Direct Link
- Report Inappropriate Content
Residual by Predicted Plot question_same data generate different plot with Fit Y by X and Fit model
Hi community,
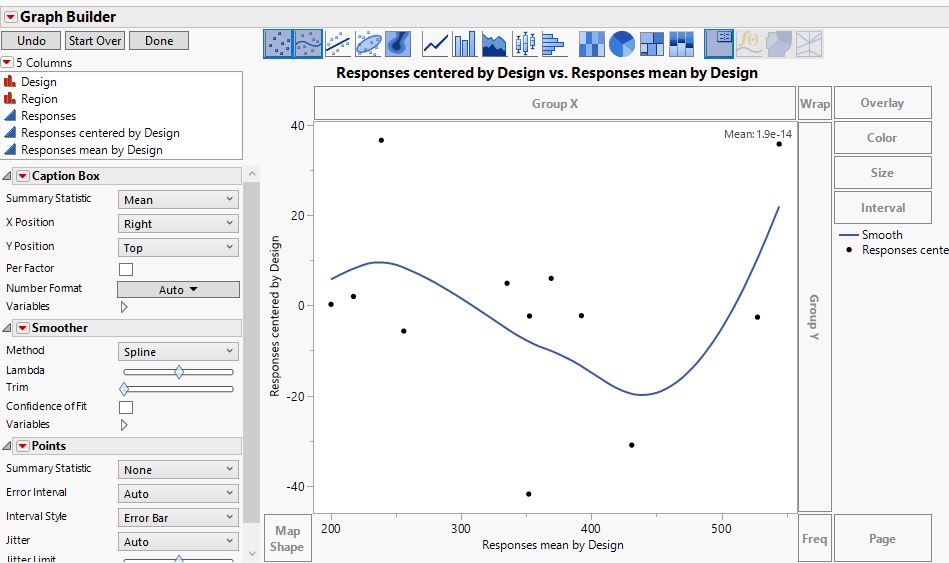
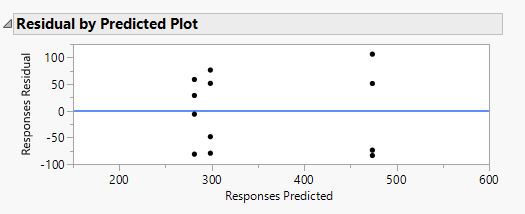
My question is on Residual by Predicted Plot. The data set is with 2 factor: Design as the interest factor and Region as Randomized block and one response. I did ANOVA in Fit Y by X and save the Residual and Predicted to plot the Residual by Predicted Plot. But I found it looks very different from the plot from Fit model (row diagnostics).
In Fit Y by X, design is selected as Factor, region is selected as Block, and Response is selected as response.
In Fit model, Design and Region is added to model effects and region is attributed as Random effect, and Response is selected as Y.
Hope somebody can help!
Kind regards,
Yuqian
Accepted Solutions

- Mark as New
- Bookmark
- Subscribe
- Mute
- Subscribe to RSS Feed
- Get Direct Link
- Report Inappropriate Content
Re: Residual by Predicted Plot question_same data generate different plot with Fit Y by X and Fit model
You used two very different models in these models. The first analysis accounted for the effect of only one of your factors (presumably Design). The effect of the blocking factor Region remained in the residuals from that model. These residuals exhibit greater variation. The second analysis accounted for both Design and Region, shrinking the residuals and producing a simpler pattern. You see the tighter pattern in the second residual plot.
Both plots are correct and valid. Their interpretation depends on the question you are asking.
- Mark as New
- Bookmark
- Subscribe
- Mute
- Subscribe to RSS Feed
- Get Direct Link
- Report Inappropriate Content
Re: Residual by Predicted Plot question_same data generate different plot with Fit Y by X and Fit model
Hi markbailey,
Thank you very much for the kind answer!
I just notice in Fit Y by X, JMP recenterized data aganist block while it is not in Fit model. I was using the residual ploy for Model Adequacy Checking (I guess a good model should be with very randomized residual without any pattern). The residual plot seems show a certain pattern with Fit Y by X, while Fit model does not. And I am very confused about that and I wonder if you have any suggestions on that.
Thanks,
Yuqian
- Mark as New
- Bookmark
- Subscribe
- Mute
- Subscribe to RSS Feed
- Get Direct Link
- Report Inappropriate Content
Re: Residual by Predicted Plot question_same data generate different plot with Fit Y by X and Fit model
I already explained the difference. The Fit Y by X analysis removes the treatment effect from the residuals but not the block effect. The Fit Least Squares analysis removes both the treatment and the block effect from the residuals. Different models lead to different residuals: Residual = y predicted - y observed. The different models led to different y predicted values.
Recommended Articles
- © 2026 JMP Statistical Discovery LLC. All Rights Reserved.
- Terms of Use
- Privacy Statement
- Contact Us