- New to JMP? Join us Sept. 23-24 for the Early User Edition of Discovery Summit, tailor-made for new users. Register now for free!
- Subscribe to RSS Feed
- Mark Topic as New
- Mark Topic as Read
- Float this Topic for Current User
- Bookmark
- Subscribe
- Mute
- Printer Friendly Page
Discussions
Solve problems, and share tips and tricks with other JMP users.- JMP User Community
- :
- Discussions
- :
- Re: Repeated measurements...sort of...

- Mark as New
- Bookmark
- Subscribe
- Mute
- Subscribe to RSS Feed
- Get Direct Link
- Report Inappropriate Content
Repeated measurements...sort of...
Suppose I have a 2^3 full factorial design with replicate, so 2x8=16 runs. Each run lasts 30 minutes, where participants are detecting and prosecuting 8 'targets' over the course of that 30 minutes. Each of the 8 targets can conceivably have its own response time. Since the target profiles vary, I am randomizing their order for each run. I don't care about a target type factor, so it is not a design factor for which I am trying to measure an effect. I am trying to detect main and 2-way effects.
Does it make sense to treat those 8 response times per run as independent observations, as if I was getting 8 response time data points for each factor level, for a total of 16x8 observations? Or instead average the 8 response times for a single observation per run? If I can use 8 observations per run, are they best treated as repeat measurements for a run? Because they're not repeated measurements -- each target is unique and I know in advance they will not produce the same response time. All 8 are subject to the same treatment of course, but they vary in other ways and it is a source of variance.
- Mark as New
- Bookmark
- Subscribe
- Mute
- Subscribe to RSS Feed
- Get Direct Link
- Report Inappropriate Content
Re: Repeated measurements...sort of...
Thanks again @Mark_Bailey I asked JMP to create the table with some fake data, then modeled the results just to implement your recommendation. With the output table, I ran two models -- one model with the three main effects terms and three 2-way terms, and the target profile term as a random effect, and one model where I simply excluded the target profile term from the model. In the first model dialog, JMP recommended REML. I am using the SLS personality and effect leverage emphasis. In the second model, without the random effect term, JMP did not prompt me for a method.
In any case, the results in both models are quite similar -- perhaps because the data were meaningless since they were synthetic. All main effects and interactions were significant at 0.05 in both models. That seems counterintuitive -- its seems like treating the profile as a random effect term should have yielded much different results. But perhaps I am comparing apples to oranges in the way that I am modeling the data with these two models. In model 2, I am probably making bad conclusions since there's an effect I didn't account for. But I would have thought that would have resulted in fewer significant effects.

- Mark as New
- Bookmark
- Subscribe
- Mute
- Subscribe to RSS Feed
- Get Direct Link
- Report Inappropriate Content
Re: Repeated measurements...sort of...
It should not affect the estimates of the fixed effects that much. Your design is orthogonal. It is like having two error terms, within and between targets. It is just more detailed information about the random variation.

- Mark as New
- Bookmark
- Subscribe
- Mute
- Subscribe to RSS Feed
- Get Direct Link
- Report Inappropriate Content
Re: Repeated measurements...sort of...
Late to the party, but there are a number of things that come to mind, though I can't say I understand what exactly you want out of the experiment.
But this sounds interesting...so if you'll indulge me I have some questions (of course if you are happy with the responses you have received, I understand):
What are responses are trying to understand? Response time? Rate of response (from detecting to prosecuting)?
What is a "target profile"? And why don't you care about the interaction between the design factors and the target profile?
Aren't you trying to choose design factors, that affect response time, robust to target profile?
It seems you're only interested in the mean? Why not the variation? It is impossible for me to think about means without some idea of the variance...it is like giving the score for one team and not the other in a sporting event.
If you are using the mean, shouldn't you first test to see if that is the appropriate statistic? What if there are unusual data points in the 8 target profiles? Then the mean might be a poor summary statistic.
You are replicating the design, why? Do you know what noise is changing between replicates? If so, wouldn't you be interested in knowing the effect of that noise and possibly noise-by-factor interactions (think robust design). Treat the replicate as a block and a fixed effect. If not, then I understand the use of the replicate to get an "unbiased" estimate of the MSE.
A further thought is to treat the design structure as the whole plot and the profile factor as the subplot of a split-plot design. I would think you would want to know more about this source based on the statement. "All 8 are subject to the same treatment of course, but they vary in other ways and it is a source of variance"
- Mark as New
- Bookmark
- Subscribe
- Mute
- Subscribe to RSS Feed
- Get Direct Link
- Report Inappropriate Content
Re: Repeated measurements...sort of...
Hi @statman jump on in.
@statman wrote:What are responses are trying to understand? Response time? Rate of response (from detecting to prosecuting)?
It's a command & control scenario where detectionTime is one (of many) measures of the effect of several design factors.
What is a "target profile"? And why don't you care about the interaction between the design factors and the target profile?
The target profiles add variety and reasonable error to the experiment, but they are simply a small sample from a large number of potential profiles. I don't really need to know whether there is a target profile effect.
Aren't you trying to choose design factors, that affect response time, robust to target profile?
well, yes
It seems you're only interested in the mean? Why not the variation? It is impossible for me to think about means without some idea of the variance...it is like giving the score for one team and not the other in a sporting event.
Hence my earlier concern that collapsing a bunch of values to a mean does not seem like a good idea. Perhaps a 90th percentile is more approp if I am trying to characterize a sample with a single value.
You are replicating the design, why? Do you know what noise is changing between replicates?
It's just the randomness associated with human operator actions. Two runs with the same factor levels will definitely yield different results, because the response is affected by human actions and decisions.
A further thought is to treat the design structure as the whole plot and the profile factor as the subplot of a split-plot design. I would think you would want to know more about this source based on the statement. "All 8 are subject to the same treatment of course, but they vary in other ways and it is a source of variance"
I tend to think of split-plot designs for cases where I have a hard-to-change factor, which is not the case here. This is a simulation where we can control the factors fairly easily from one run to the next.
- Mark as New
- Bookmark
- Subscribe
- Mute
- Subscribe to RSS Feed
- Get Direct Link
- Report Inappropriate Content
Re: Repeated measurements...sort of...
You need to read "Split-plot designs for robust product experimentation" Box and Jones, Journal of Applied Statistics, Vol. 19, No.1, 1992. Hard to change factors is only one reason to do split-plots (and not the best reason). Restrictions on randomization can be used effectively to partition the noise in an experiment to simultaneously increase precision for detecting factor effects while not negatively affecting inference space.
When you are calculating the mean to use as a response variable, also calculate the standard deviation (or variance) and us eat as a response variable.
It seems you ultimately want to understand human actions and decisions. Randomizing those will not allow for estimating those effects nor will it allow understanding of those effects.
- Mark as New
- Bookmark
- Subscribe
- Mute
- Subscribe to RSS Feed
- Get Direct Link
- Report Inappropriate Content
Re: Repeated measurements...sort of...
Ok, so in the split-plot option, I suppose I'd develop say, 6 scenarios that involve various target profiles. Those scenarios would be the main plots and would occupy a day. Then within those main plots, I would have split plots for levels of the system design under investigation: system A, system B.
| day | 1 | 2 | 3 | 4 | 5 | 6 |
| am | A | A | B | A | B | B |
| pm | B | B | A | B | A | A |
| Scenario | 5 | 2 | 3 | 1 | 4 | 6 |
What are the real benefits of this approach, if as is my case that changing the scenarios is not difficult?
- Mark as New
- Bookmark
- Subscribe
- Mute
- Subscribe to RSS Feed
- Get Direct Link
- Report Inappropriate Content
Re: Repeated measurements...sort of...
It sounds like you are changing your original description of the situation. For your proposal, you are confounding the "scenarios" with Day (and the associated noise) which would not be a benefit. What I am suggesting is for each whole plot treatment combination (the factorial stated in your original post, I believe 2^3), run a set of treatments based on a factorial of target profiles (not sure what changes profile -to-profile, but I would think you could identify what those x's are and experiment on them). Instead of repeats, the factorial of the profile factors would create the sub plot. Since the whole plot and the sub plot degrees of freedom are analyzed separately (e.g., each with their own normal plot), you have increased the precision of the whole plot (less noise in just the whole plot) and increased the precision of the sub plot as well. Also you will get WP by SP interactions, so if the factors in the whole plots effects depend on which target profile was being used, you would be able to identify and quantify this.
- Mark as New
- Bookmark
- Subscribe
- Mute
- Subscribe to RSS Feed
- Get Direct Link
- Report Inappropriate Content
Re: Repeated measurements...sort of...
To be clear, our 30-minute runs consist of multiple targets and the only real reason we’re doing multiple ‘profiles‘ is so that there is operational variety and to help avoid a learning effect. If there’s a more common way to handle such issues, then I’d like to hear about those rather than unnecessarily force the experiment into a particular design.
- Mark as New
- Bookmark
- Subscribe
- Mute
- Subscribe to RSS Feed
- Get Direct Link
- Report Inappropriate Content
Re: Repeated measurements...sort of...
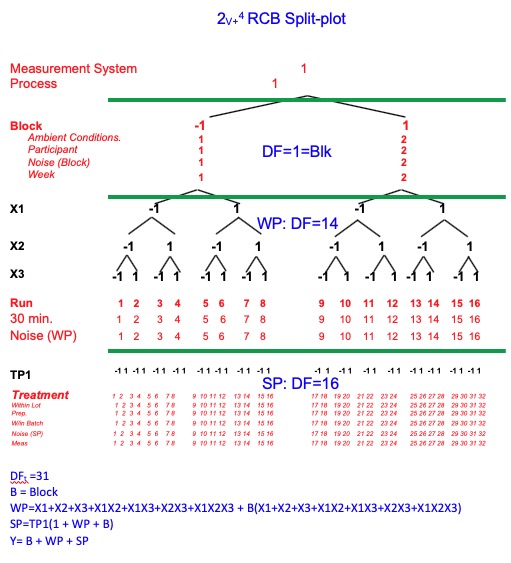
I have attached a picture of the Factor Relationship Diagram. This includes the block, X1-X3 design factors in the whole plot and one factor for the Target Profile (TP) in the subplot (TP1 could be TP1-TP3 in a factorial if you want 8 different configurations of the target profiles, e.g, target size, target distance, target color). Or since you don't care about resolution of the TP factors (you're just trying to create a large inference space) you could do this in 4 treatments (half fraction of the 3 TP factors) per 30 minute run. Or you could take advantage of split-plot confounding to further reduce the number of treatments...with very little sacrifice of resolution. I would need to know more specifics of your situation.
- « Previous
-
- 1
- 2
- Next »
Recommended Articles
- © 2026 JMP Statistical Discovery LLC. All Rights Reserved.
- Terms of Use
- Privacy Statement
- Contact Us