Turn on suggestions
Auto-suggest helps you quickly narrow down your search results by suggesting possible matches as you type.
- Don’t miss your chance to experience Discovery Summit Europe at our best available rate! Early bird registration through 31 Oct.
- Image to Table JMP extension imports single or batch images as data tables. Useful to extract curves from pictures or convert image data to curve data to use in analyses like Functional Data Explorer. Download and install the extension.
Options
- Subscribe to RSS Feed
- Mark Topic as New
- Mark Topic as Read
- Float this Topic for Current User
- Bookmark
- Subscribe
- Mute
- Printer Friendly Page
Discussions
Solve problems, and share tips and tricks with other JMP users.- User Community
- :
- Discussions
- :
- Re: Referencing Box Plot outliers checkbox in Graph Builder

Level VII
- Mark as New
- Bookmark
- Subscribe
- Mute
- Subscribe to RSS Feed
- Get Direct Link
- Report Inappropriate Content
Referencing Box Plot outliers checkbox in Graph Builder
Created:
Sep 8, 2023 08:51 AM
| Last Modified: Sep 8, 2023 5:54 AM
(2431 views)
Hi,
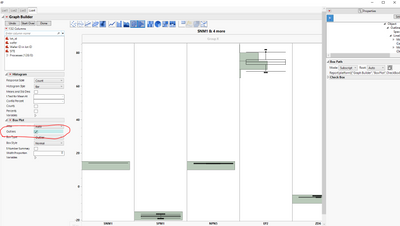
How can I reference the checkbox in the box plot option using jsl?
I tried the following but doesn't work. Any Suggestions?
checkboxes = nw << XPath("(//OutlineBox[text()='Plots']//OutlineBox[text()='Box Plot']//CheckBoxBox)");
checkboxes[N Items(checkboxes)] << Set All(0);
Names Default To Here( 1 );

dt = Open( "$SAMPLE_DATA/Semiconductor Capability.jmp" );

List1 = {"NPN1", "PNP1", "PNP2", "NPN2", "PNP3", "IVP1"};
List2 = {"PNP4", "NPN3", "IVP2", "NPN4", "SIT1"};
List3 = {"INM1", "INM2", "VPM1", "VPM2", "VPM3"};
List4 = {"SNM1", "SPM1", "NPN5", "EP2", "ZD6"};

var expr1 = Expr( Variables() );
For( c = 1, c <= N Items( List1 ), c++,
	x expr1 = Expr(
		X( Position( 1 ), Combine( "Parallel Merged" ) )
	);
	Insert Into( x expr1, List1[c], 1 );
	Insert Into( var expr1, Name Expr( x expr1 ) );
);

var expr2 = Expr( Variables() );
For( c = 1, c <= N Items( List2 ), c++,
	x expr2 = Expr(
		X( Position( 1 ), Combine( "Parallel Merged" ) )
	);
	Insert Into( x expr2, List2[c], 1 );
	Insert Into( var expr2, Name Expr( x expr2 ) );
);

var expr3 = Expr( Variables() );
For( c = 1, c <= N Items( List3 ), c++,
	x expr3 = Expr(
		X( Position( 1 ), Combine( "Parallel Merged" ) )
	);
	Insert Into( x expr3, List3[c], 1 );
	Insert Into( var expr3, Name Expr( x expr3 ) );
);

var expr4 = Expr( Variables() );
For( c = 1, c <= N Items( List4 ), c++,
	x expr4 = Expr(
		X( Position( 1 ), Combine( "Parallel Merged" ) )
	);
	Insert Into( x expr4, List4[c], 1 );
	Insert Into( var expr4, Name Expr( x expr4 ) );
);


lists = {"List1", "List2", "List3", "List4"};
var = {};
gbv = {};

For( i = 1, i <= 4, i++,
	Insert Into( var, Name Expr( Eval( Parse( "var expr" || Char( i ) ) ) ) );
	Insert Into( gbv, Parse( "vvv" || Char( i ) ) );
);

nw = New Window( "Plots",
	Show Menu( 0 ),
	show toolbars( 0 ),
	H List Box(

		Check Box(
			{"Summary"},

			<<Set Function(
				Function( {self},

					sel = self << get selected();
					If( N Items( sel ) > 0,
						For( i = 1, i <= N Items( lists ), i++,
							If( N Items( Eval( Parse( lists[i] ) ) ) > 0,
								nw[lists[i], Outline Box( 1 )] << append(


									V Scroll Box(
										size( 580 ),
										Border Box( Left( 5 ), Right( 5 ), Top( 5 ), Bottom( 5 ), Sides( 15 ),
											Tabulate(
												Show Control Panel( 0 ),
												Set Format( Uniform Format( 10, 2 ) ),
												Add Table(
													Column Table( Statistics( Mean, Std Dev ) ),
													Row Table(
														Analysis Columns(
															Eval( Parse( lists[i] ) )

														)
													)
												),


												SendToReport(
													Dispatch( {}, "Tabulate", OutlineBox, {Set Title( "Summary Stats" )} )


												)
											)
										)
									)


								) << Visibility( "Visible" );

							)
						);

					,
					/// Xpath syntax

	nw << XPath( "//Outlinebox[@helpKey = 'Summary Stats']" ) << delete;


					);
				);

			)


		),
		V List Box( tb = Tab Box() )
	)
);

For( i = 1, i <= N Items( lists ), i++,
	tb << Add(
		lists[i],
		V List Box(
			H List Box(
				Eval(
					Eval Expr(
						gb = dt << Graph Builder(
							Size( 1117, 781 ),
							Show Control Panel( 0 ),

							Expr( Name Expr( var[i] ) ),
							Elements(
								Histogram(
									X( 1 ),
									X( 2 ),
									X( 3 ),
									X( 4 ),
									X( 5 ),
									X( 6 ),
									X( 7 ),
									X( 8 ),
									X( 9 ),
									X( 10 ),
									X( 11 ),
									X( 12 ),
									X( 13 ),
									X( 14 ),
									X( 15 ),
									X( 16 ),

									Legend( 2 ),

								),
								Box Plot(
									X( 1 ),
									X( 2 ),
									X( 3 ),
									X( 4 ),
									X( 5 ),
									X( 6 ),
									X( 7 ),
									X( 8 ),
									X( 9 ),
									X( 10 ),
									X( 11 ),
									X( 12 ),
									X( 13 ),
									X( 14 ),
									X( 15 ),
									X( 16 ),

									Legend( 3 ),
									Outliers( 0 )
								)
							)
						)
					)
				),
				sumsta = Outline Box(

					lists[i],
					<<visibility( "Collapse" )


				)


			)
		)
	);


);
1 ACCEPTED SOLUTION
Accepted Solutions


Super User
Solution
- Mark as New
- Bookmark
- Subscribe
- Mute
- Subscribe to RSS Feed
- Get Direct Link
- Report Inappropriate Content
Re: Referencing Box Plot outliers checkbox in Graph Builder
Created:
Sep 8, 2023 09:15 AM
| Last Modified: Sep 8, 2023 6:24 AM
(2421 views)
| Posted in reply to message from Jackie_ 09-08-2023
Use << Get XML to see what you are looking for

And then use pure XPath or combine it with other ways of getting references
(((nw << XPath("//MouseBox/TextBox[text()='Outliers']")) << parent) << sib)
Edit:
With XPath you could use something like this or make it more robust
(nw << XPath("//MouseBox/TextBox[text()='Outliers']/../following-sibling::CheckBoxBox[1]"))
-Jarmo
3 REPLIES 3
Super User
Solution
- Mark as New
- Bookmark
- Subscribe
- Mute
- Subscribe to RSS Feed
- Get Direct Link
- Report Inappropriate Content
Re: Referencing Box Plot outliers checkbox in Graph Builder
Created:
Sep 8, 2023 09:15 AM
| Last Modified: Sep 8, 2023 6:24 AM
(2421 views)
| Posted in reply to message from Jackie_ 09-08-2023
Use << Get XML to see what you are looking for
And then use pure XPath or combine it with other ways of getting references
(((nw << XPath("//MouseBox/TextBox[text()='Outliers']")) << parent) << sib)
Edit:
With XPath you could use something like this or make it more robust
(nw << XPath("//MouseBox/TextBox[text()='Outliers']/../following-sibling::CheckBoxBox[1]"))
-Jarmo
Level VII
- Mark as New
- Bookmark
- Subscribe
- Mute
- Subscribe to RSS Feed
- Get Direct Link
- Report Inappropriate Content
Re: Referencing Box Plot outliers checkbox in Graph Builder
Awesome! Thanks Jarmo
Level VII
- Mark as New
- Bookmark
- Subscribe
- Mute
- Subscribe to RSS Feed
- Get Direct Link
- Report Inappropriate Content
Re: Referencing Box Plot outliers checkbox in Graph Builder
Created:
Sep 8, 2023 09:35 AM
| Last Modified: Sep 8, 2023 6:42 AM
(2413 views)
| Posted in reply to message from jthi 09-08-2023
@jthi It works only for one tab. How could I reference all the checkboxes for all tabs?
Edit: NVM it works.
Recommended Articles
- © 2026 JMP Statistical Discovery LLC. All Rights Reserved.
- Terms of Use
- Privacy Statement
- Contact Us