- Don’t miss your chance to experience Discovery Summit Europe at our best available rate! Early bird registration through 31 Oct.
- Graph Builder Toolbar streamlines interactive graphing. Creates shortcuts on Report and GraphBuilder Helpers toolbars. Download and install the extension.
- Subscribe to RSS Feed
- Mark Topic as New
- Mark Topic as Read
- Float this Topic for Current User
- Bookmark
- Subscribe
- Mute
- Printer Friendly Page
Discussions
Solve problems, and share tips and tricks with other JMP users.- User Community
- :
- Discussions
- :
- Randome sampling from a lognormal distribution shape

- Mark as New
- Bookmark
- Subscribe
- Mute
- Subscribe to RSS Feed
- Get Direct Link
- Report Inappropriate Content
Randome sampling from a lognormal distribution shape
Hi all,
I have a distribution lognormal with bellow shape/scale parameter (made by 165 data)
Now I want to randome sampling with different sample size (5pcs, 10pcs...)
What I want is I expect when running more data it will still follow this distribution shape.
So I want to simulate what kind of data I will receive when sampling 5/ 10/20 samples in different times.
I expect each time will show abit different result just cause by sampling eror
Are there any way I can do it in Jmp

Accepted Solutions

- Mark as New
- Bookmark
- Subscribe
- Mute
- Subscribe to RSS Feed
- Get Direct Link
- Report Inappropriate Content
Re: Randome sampling from a lognormal distribution shape
If I understand your interest correctly, I think Simulate ( https://www.jmp.com/support/help/en/17.1/#page/jmp/simulate.shtml# ) is what you need.
The idea is so sub-sample from your data and fit Lognormal repeatedly and collect summary statistics. I attach a modified Big Class sample data to illustrate.
Run the script in the data table. It fits Lognormal to "weight" variable, but use "random freq" as Freq.
Now right click on a statistic of interest, and choose "Simulate":
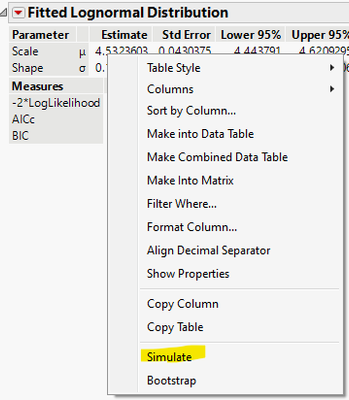
In the dialog, choose "random freq" on both sides, click Ok:

And you will get a table like the following:

The last two columns are the summary statistics of individual fits to sub-samples.
The "random freq" column use "Resample Freq" function:
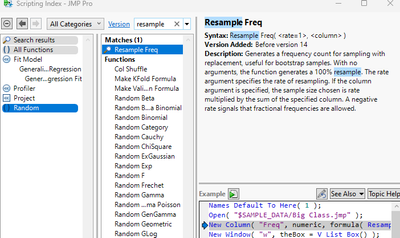
What you need to do is to tweak the threshold in the column formula, so you can get the total of 5/10/20 as you wish.

- Mark as New
- Bookmark
- Subscribe
- Mute
- Subscribe to RSS Feed
- Get Direct Link
- Report Inappropriate Content
Re: Randome sampling from a lognormal distribution shape
If I understand your interest correctly, I think Simulate ( https://www.jmp.com/support/help/en/17.1/#page/jmp/simulate.shtml# ) is what you need.
The idea is so sub-sample from your data and fit Lognormal repeatedly and collect summary statistics. I attach a modified Big Class sample data to illustrate.
Run the script in the data table. It fits Lognormal to "weight" variable, but use "random freq" as Freq.
Now right click on a statistic of interest, and choose "Simulate":
In the dialog, choose "random freq" on both sides, click Ok:
And you will get a table like the following:
The last two columns are the summary statistics of individual fits to sub-samples.
The "random freq" column use "Resample Freq" function:
What you need to do is to tweak the threshold in the column formula, so you can get the total of 5/10/20 as you wish.


- Mark as New
- Bookmark
- Subscribe
- Mute
- Subscribe to RSS Feed
- Get Direct Link
- Report Inappropriate Content
Re: Randome sampling from a lognormal distribution shape
This example illustrates how you can use the parameter estimates for the distribution model to simulate new samples of different sizes.
Names Default to Here( 1 );

// role of arguments
nRows = 25;
nCols = 1;
μ = 1.038356;
σ = 0.7746626;

sample = J( nRows, nCols, Random Lognormal( μ, σ ) );

dt = New Table( "Sample from LogNormal Population",
	New Column( "Sample", "numeric", "Continuous", Values( sample ) )
);

dt << Distribution( Y( :Sample ) );Recommended Articles
- © 2026 JMP Statistical Discovery LLC. All Rights Reserved.
- Terms of Use
- Privacy Statement
- Contact Us