- Don’t miss your chance to experience Discovery Summit Europe at our best available rate! Early bird registration through 31 Oct.
- Image to Table JMP extension imports single or batch images as data tables. Useful to extract curves from pictures or convert image data to curve data to use in analyses like Functional Data Explorer. Download and install the extension.
- Subscribe to RSS Feed
- Mark Topic as New
- Mark Topic as Read
- Float this Topic for Current User
- Bookmark
- Subscribe
- Mute
- Printer Friendly Page
Discussions
Solve problems, and share tips and tricks with other JMP users.- User Community
- :
- Discussions
- :
- Random decimals incorporated in mixture screening design

- Mark as New
- Bookmark
- Subscribe
- Mute
- Subscribe to RSS Feed
- Get Direct Link
- Report Inappropriate Content
Random decimals incorporated in mixture screening design
Hi :)
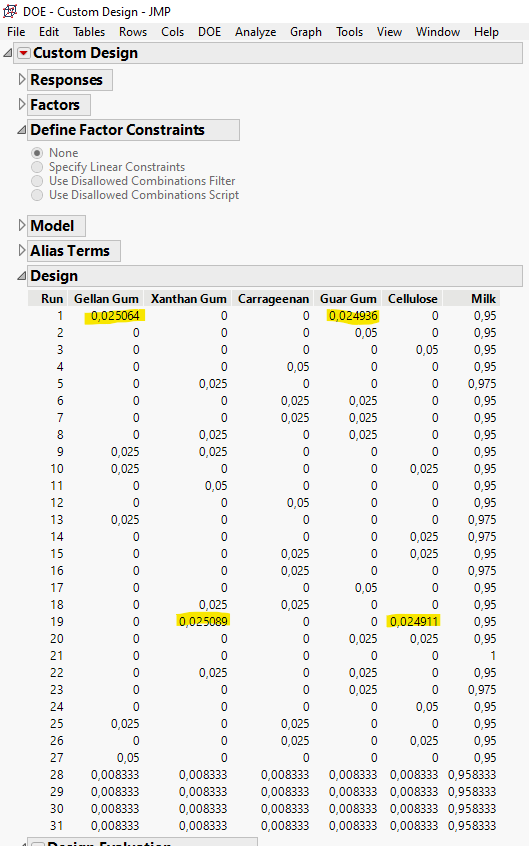
I wonder why JMP introduces the four highlighted numbers (yellow) in the design (0.025064, 0.024936, 0.025089 and 0.024911)? Why are these four values not 0.025?
Accepted Solutions


- Mark as New
- Bookmark
- Subscribe
- Mute
- Subscribe to RSS Feed
- Get Direct Link
- Report Inappropriate Content
Re: Random decimals incorporated in mixture screening design
Hi @Principles77,
Welcome in the Community !
The Custom design platform uses the Coordinate-Exchange Algorithm to create designs based on random points, and then move the coordinates of these random points to improve the design based on defined optimality criterion and converge to a specific design.
LinkedIn post on this topic : https://www.linkedin.com/feed/update/urn:li:activity:7163071856332234752/
The "stange" and very precise values you see are a result of this algorithm computation.
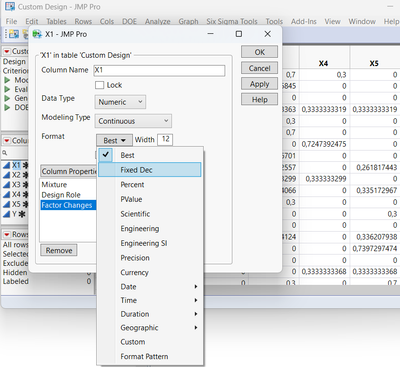
When you make your datatable, you can always change the format of the column and limit the number of decimals (double-click on the factors column, click on Format and set the "Fixed Dec" to the number of decimals you want) :
Hope this response answers your question,
"It is not unusual for a well-designed experiment to analyze itself" (Box, Hunter and Hunter)
- Mark as New
- Bookmark
- Subscribe
- Mute
- Subscribe to RSS Feed
- Get Direct Link
- Report Inappropriate Content
Re: Random decimals incorporated in mixture screening design
Hi @Principles77,
Welcome in the Community !
The Custom design platform uses the Coordinate-Exchange Algorithm to create designs based on random points, and then move the coordinates of these random points to improve the design based on defined optimality criterion and converge to a specific design.
LinkedIn post on this topic : https://www.linkedin.com/feed/update/urn:li:activity:7163071856332234752/
The "stange" and very precise values you see are a result of this algorithm computation.
When you make your datatable, you can always change the format of the column and limit the number of decimals (double-click on the factors column, click on Format and set the "Fixed Dec" to the number of decimals you want) :
Hope this response answers your question,
"It is not unusual for a well-designed experiment to analyze itself" (Box, Hunter and Hunter)
Recommended Articles
- © 2026 JMP Statistical Discovery LLC. All Rights Reserved.
- Terms of Use
- Privacy Statement
- Contact Us